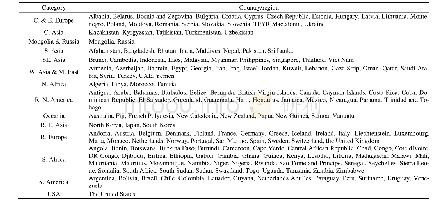
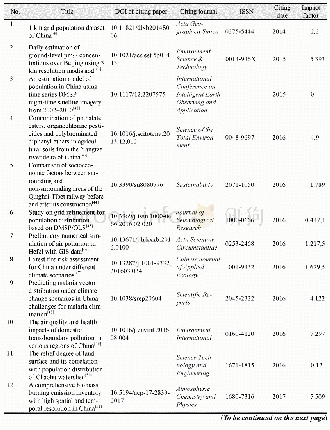
《Table 3 Statistics of land, population and economy at different RDLS》
 提示:宽带有限、当前游客访问压缩模式
本系列图表出处文件名:随高清版一同展现
《基于栅格的豫西山区地形起伏特征及其对人口和经济的影响(英文)》
As the RDLS increased,population density,economic density,total population and gross regional product all decreased sharply(Table 3).When the RDLS is 0–0.1,the population and economic densities peaked at 728.91 people/km2 and 45.43 million yuan/km2,respectively.The total population and gross regional product were 8.9242 million and 570.736 billion yuan,respectively.About 49.86%of the population lived in 25%of the study area and generated 64.07%of the gross regional product.When the RDLS increased from 0–0.1 to0.3–0.5,the decrease in population and economic densities was the largest,with a decrease of 49.3%and 61.9%,respectively.The total population and gross regional product dropped by 3.28 million and 156.636 billion yuan,respectively.When the RDLS is 0.5–0.7,the decrease in population and economic densities gradually slowed,and the cumulative frequencies of population and gross regional product reached about 95%.When the RDLS ranged1.6–2.23,the population and economic densities were 45.46 people/km2 and 0.604 million yuan/km2,respectively,and the total population and gross regional product accounted for0.07%and 0.02%of that of the whole study area,respectively.In summary,88.65%of the population in the study area lived in regions where the RDLS is<0.5,which accounts for58.6%of the total area.In terms of gross regional product,88.03%was distributed in regions where the RDLS is<0.3,which accounts for 44.07%of the total area.Therefore,the study area is characterized by unbalanced population distribution and strong economic agglomeration effect.
| 图表编号 | XD0062094800 严禁用于非法目的 |
|---|---|
| 绘制时间 | 2019.04.01 |
| 作者 | 张静静、朱文博、朱连奇、崔耀平、何莎莎、任涵 |
| 绘制单位 | College of Environment and Planning,Henan University、College of Environment and Planning,Henan University、College of Environment and Planning,Henan University、College of Environment and Planning,Henan University、College of Environment and Planning,Henan U |
| 更多格式 | 高清、无水印(增值服务) |


