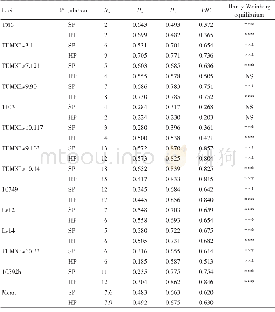
《Tab.5 F-statistics for two populations of L.vannamei at 13 microsatellite loci》
 提示:宽带有限、当前游客访问压缩模式
本系列图表出处文件名:随高清版一同展现
《Comparison of Genetic Diversity and Growth Performance between the Selected Population and Hybridized Population of Litopenaeus vannamei at Low Temperature》
Wright[20]has suggested qualitative guidelines for interpretation of the index:from0 to 0.05 is considered as indicating little genetic differentiation,from 0.05 to 0.15indicates moderate genetic differentiation,from 0.15 to 0.25 indicates great genetic differentiation,above 0.25 indicates very great genetic differentiation.As shown in Tab.5,the average value of FSTof the 13microsatellite loci was 0.156 6.Among them,four loci(TM6,TUMXLv9.90,TUMXLv10.14 and TUMXLv10.33)had a FSTvalue below 0.05 indicating little genetic differentiation,five loci(TUMXLv7.121,TUMXLv9.103,10749,Lv12 and10592b)had a FST value between 0.05and 0.15,indicating moderate genetic differentiation,and the other four loci(TUMXLv3.1,1103,TUMXLv10.117 and Lv14)had a FST value above 0.15,indicating great or very great genetic differentiation.
| 图表编号 | XD00183479200 严禁用于非法目的 |
|---|---|
| 绘制时间 | 2018.06.01 |
| 作者 | Li Dongyu、Meng Xianhong、Kong Jie、Luan Sheng、Cao Baoxiang、Luo Kun |
| 绘制单位 | Key Laboratory of Sustainable Development of Marine Fisheries, Ministry of Agriculture, Yellow Sea Fisheries Research Institute, Chinese Academy of Fishery Sciences、Laboratory for Marine Fisheries Science and Food Production Processes, Qingdao National La |
| 更多格式 | 高清、无水印(增值服务) |


