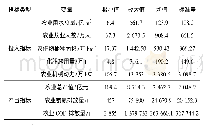
《Table 3 Descriptive statistics of input and output indexes in Northeast China in 2014 at the county
 提示:宽带有限、当前游客访问压缩模式
本系列图表出处文件名:随高清版一同展现
《Suitability Analysis of Scale Management in Northeast China Based on Efficiency Evaluation》
The spatial scale of this paper is base don 147 counties and cities in the northeastern three provinces,and the time section is 2014,focusing on the regional differences in the use efficiency of cultivated land in Northeast China and the characteristics of its decomposition efficiencies.According to the requirements of the DEA model,an evaluation model covering one output index and five input indexes is constructed.The output index is food production,and the input indexes are sown area,agricultural population,total power of agricultural machinery,amount of fertilizer applied and effective irrigated area.The data mainly comes from corresponding year's Jilin Statistical Yearbook,Liaoning Statistical Yearbook,Heilongjiang Statistical Yearbook,China County(City)Social and Economic Statistical Yearbook and China Agricultural Statistical Yearbook.
| 图表编号 | XD00182623900 严禁用于非法目的 |
|---|---|
| 绘制时间 | 2018.10.01 |
| 作者 | Wenxin LIU、Xiuli HE |
| 绘制单位 | Northeast Institute of Geography and Agricultural Ecology,Chinese Academy of Sciences、Northeast Institute of Geography and Agricultural Ecology,Chinese Academy of Sciences |
| 更多格式 | 高清、无水印(增值服务) |


