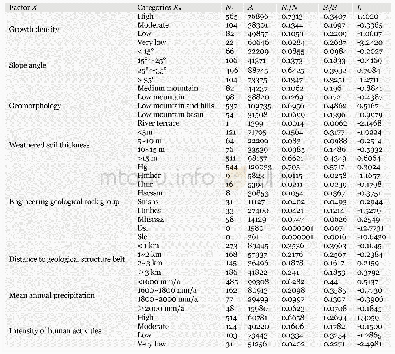
《Table 7 Information values of each category of factor》
 提示:宽带有限、当前游客访问压缩模式
本系列图表出处文件名:随高清版一同展现
《"Landslide integrated characteristics and susceptibility assessment in Rongxian county of Guangxi,China"》
The samples of landslide presence and landslide absence can be selected from grid data.The selection criterion is that the number ratio of two samples is approximately equal to 1(Ayalew and Yamagishi 2005).In study area,772 samples with landslide presence and 798 samples with landslide absence are selected.Because LRM has an automatic function of selecting factors,the factor that has little contribution to landslide can be excluded from the model(Ayalew and Yamagishi 2005;Budimir et al.2015;Devkota et al.2012;Lee and Pradhan 2006;Park et al.2013)Then the logistic coefficients of each category can be calculated by the statistical software SPSS20(as shown in Table 8).These coefficients are put into Eq.(3),and the P of each grid unit is obtained.In this research,the range of P is from 0.064 to 0.982.The range is divided into four intervals as follows:0.06~0.2(very low),0.2~0.4(low),0.4~0.8(moderate),0.8~0.982(high).
| 图表编号 | XD0056568200 严禁用于非法目的 |
|---|---|
| 绘制时间 | 2019.03.01 |
| 作者 | LIAO Li-ping、ZHU Ying-yan、ZHAO Yan-lin、WEN Hai-tao、YANG Yun-chuan、CHEN Li-hua、MA Shao-kun、XU Ying-zi |
| 绘制单位 | College of Civil Engineering and Architecture,Guangxi University、Key Laboratory of Disaster Prevention and Structural Safety of Ministry of Education,Guangxi University、Guangxi Key Laboratory of Disaster Prevention and Engineering Safety,Guangxi Universit |
| 更多格式 | 高清、无水印(增值服务) |


