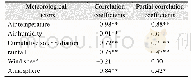
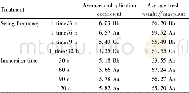
《Table 8 Logistic coefficient of each category of factor》
 提示:宽带有限、当前游客访问压缩模式
本系列图表出处文件名:随高清版一同展现
《"Landslide integrated characteristics and susceptibility assessment in Rongxian county of Guangxi,China"》
Notes:Bi=logistic coefficient;S.E=standard error of estimate;Wald=Wald Chi-square values;Df=degree of freedom;Sig=significance.
Landslidesusceptibilitymapswithout validation have no scientific significance(Chung and Fabbri 2003;Meng et al.2016;Pourghasemi et al.2013;Youssef et al.2016;Zhao et al.2015).The ways of validation include mathematical and statistical methods(Bourenane et al.2016).A direct method is overlaying the susceptibility map with the landslide inventory map(Le et al.2016).The results of the three models show that when the susceptive class rises,the landslide number increases(Table 6).Furthermore,the landslide densities in these three models decrease in the fall of susceptive class.When the susceptive class decreases,the densities of SQM are 0.86,0.24,0.19 and 0.07;the densities of IVM are 0.80,0.22,0.06 and o.31;the densities of LRM are 0.82,0.22,0.12 and o.05.The final results are consistent with the existing rule.That is,the landslide number of the high susceptibility region is larger than that of the low susceptibility region.As a consequence,the landslide susceptibility maps obtained from these three models are appropriate and acceptable(Bourenane et al.2016).
| 图表编号 | XD0056568700 严禁用于非法目的 |
|---|---|
| 绘制时间 | 2019.03.01 |
| 作者 | LIAO Li-ping、ZHU Ying-yan、ZHAO Yan-lin、WEN Hai-tao、YANG Yun-chuan、CHEN Li-hua、MA Shao-kun、XU Ying-zi |
| 绘制单位 | College of Civil Engineering and Architecture,Guangxi University、Key Laboratory of Disaster Prevention and Structural Safety of Ministry of Education,Guangxi University、Guangxi Key Laboratory of Disaster Prevention and Engineering Safety,Guangxi Universit |
| 更多格式 | 高清、无水印(增值服务) |
