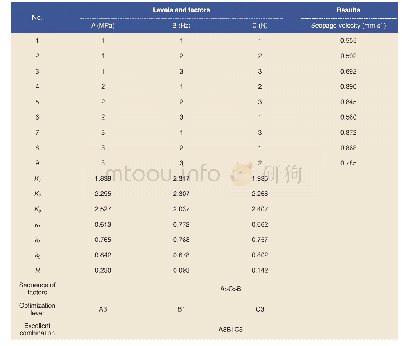
《Table 2 Results of hierarchical partitioning protocol analysis on independent percentage contributi
 提示:宽带有限、当前游客访问压缩模式
本系列图表出处文件名:随高清版一同展现
《Spatial Distribution Prediction of Habitats Selected by Wintering Common Cranes(Grus grus) at Yeya Lake Wetlands under Land Use Change》
Note:In hierarchical partitioning protocol analysis,Z score is calcu-lated as(observed mean (1 000 randomizations)) /SD(1 000 random-izations),and statistical significance is based on the upper 0.95 con-fidence limit(Z=1.65);*means the data were si
The logistic regression equation of the final model was y=46.6153-0.1014E+0.0018W+0.0010H-0.0026G-0.0012F-0.0017B-0.0005R,y means the dependent variable of the binary logistic model with two possible values“0”and“1”;E expresses elevation;W expresses distance to waters;H expresses distance to residential area and construction land;G expresses distance to grassland and marsh;F expresses distance to farmland;B expresses distance to bush land;R expresses distance to road.The y was calculated using raster calculator function in spatial analyst tools,combining the raster layers as defined by the equation.The inverse logistic transformation was P=expy/(1+expy),P means probability of occurrence.Probability of occurrence was calculated also using raster calculator function in spatial analyst tools to produce Grus grus occurrence probability across study area(Fig.2).Higher occurrence probability happened on the areas of the farmlands and the grasslands and marshes,whereas lower occurrence probability happened on the areas of the residential area and construction lands and waters.The area under the curve of the receiver operating characteristic plot was(0.831±0.022)in2006 and(0.806±0.024)in 2009(Table 4),implying the present model was effective.
| 图表编号 | XD0054133900 严禁用于非法目的 |
|---|---|
| 绘制时间 | 2019.02.01 |
| 作者 | CAO Zhen、ZHANG Yu、GUO Lida、LI Can、HONG Jianming、GAO De |
| 绘制单位 | Department of Chemical and Environmental Engineering, Hebei College of Industry and Technology、Department of Resources and Environmental Science, Hebei Normal University、Department of Chemical and Environmental Engineering, Hebei College of Industry and T |
| 更多格式 | 高清、无水印(增值服务) |


