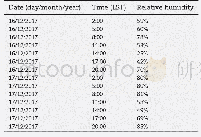
《Table 1–Relative humidity at Baoding during 16–17December 2016.》
 提示:宽带有限、当前游客访问压缩模式
本系列图表出处文件名:随高清版一同展现
《"Comparison of mixing layer height inversion algorithms using lidar and a pollution case study in Baoding, China"》
The results are in great agreement with each other.Although the absolute values of MLHs retrieved by different methods are slightly different,the evolution trend of the mixing layer is the same.Here we used the MLH data retrieved by using IEDM method in the following discussion.The mixing layer kept on growing up from 12:00 to14:39 with the induced thermal activity of the ground;the MLH had almost been doubled.After that time,the MLH of16 December did not decrease but continued to remain nearly unchanged in stark contrast to achieve the maximum at around 14:00 as its daily routine(Lv et al.,2017)The wind speed began to decrease and the relative humidity began to increase after 15:00,which are presented in Fig.4 and Table 1.The static meteorological conditions were favorable for the accumulation and outbreak of particulates.As a result,the concentration of PM2.5and PM10increased sharply and the pollution was getting more serious.Fig.5 shows the time series of the PM2.5,PM10and AQI.Moreover,the MLH even had a slight increase after 21:00,which shows a different phenomenon:the increase of PM2.5concentration in Gucheng was not associated with MLH's decrease.The diurnal pattern of mixing layer height that one peak at 14:00–15:00 and a valley at 07:00–08:00 was destroyed.The evolution of the boundary layer in Gucheng under heavy pollution shows a completely different trend.
| 图表编号 | XD0052054000 严禁用于非法目的 |
|---|---|
| 绘制时间 | 2019.05.15 |
| 作者 | Xiangguang Ji、Cheng Liu、Zhouqing Xie、Qihou Hu、Yunsheng Dong、Guangqiang Fan、Tianshu Zhang、Chengzhi Xing、Zhuang Wang、Zeeshan Javed、Jianguo Liu |
| 绘制单位 | School of Environmental Science and Optoelectronic Technology, University of Science and Technology of China、Key Lab of Environmental Optics and Technology, Anhui Institute of Optics and Fine Mechanics, Hefei Institutes of Physical Science, Chinese Academ |
| 更多格式 | 高清、无水印(增值服务) |
查看“Table 1–Relative humidity at Baoding during 16–17December 2016.”的人还看了
-

- Table 7 Precipitation and relative soil humidity at each growth stage of spring potato in Pengzhou City
-

- Table 3 Effect of relative humidity (RH) on growth performance of broilers at chronic moderate ambient temperature (Ta)


![表3 AT石英晶体[15,16]和压电陶瓷PZT-5H[17]的物理特性](http://bookimg.mtoou.info/tubiao/gif/KXJS201926022_07200.gif)


