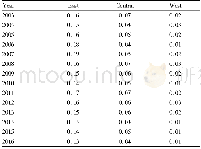
《Table 2.Nutrient concentrations measured during the three cruises at the surface layer》
 提示:宽带有限、当前游客访问压缩模式
本系列图表出处文件名:随高清版一同展现
《Response of size-fractionated phytoplankton to environmental factors near the Changjiang Estuary》
Note:SE is abbreviated from standard error.
Field cruises were conducted in April 2010,May 2010 and October 2010 in the Changjiang Estuary and its adjacent sea.As illustrated in Fig.1,the sampling sites were located at approximately 27.5°–32.5°N,120°–124.2°E.A total of eight transects were conducted.Due to marine conditions and unfavorable weather conditions,the sampling stations and transects were not fixed.Detailed information about the cruises,sampling stations and transects are listed in Table 1.
| 图表编号 | XD0040194800 严禁用于非法目的 |
|---|---|
| 绘制时间 | 2019.01.01 |
| 作者 | Li Li、Jingyi Cen、Lei Cui、Songhui Lu |
| 绘制单位 | Research Center for Harmful Algae and Marine Biology, Jinan University、Key Laboratory of Eutrophication and Red Tide Prevention of Guangdong Higher Education Institutes, Jinan University、Research Center for Harmful Algae and Marine Biology, Jinan Universi |
| 更多格式 | 高清、无水印(增值服务) |
查看“Table 2.Nutrient concentrations measured during the three cruises at the surface layer”的人还看了
-

- Table 3Differences in agricultural producer service industry in the three major regions during 2003-2016 based on Theil
-

- Table 2.Logistic modeling of density values measured from test malts during fermentations using the miniature fermentati


