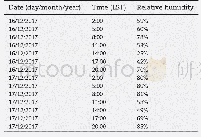
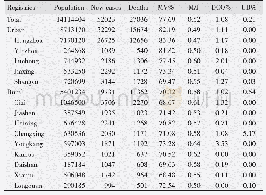
《Table 2 PAR data in December,2015 at the Sub-Center for Atmosphere station》
The record“-9999”on December 13,2015 in Table 2 indicates that the PAR data are missing or invalid as they do not meet the requirements of quality control standard.The records in the last column of Table 2 are the amount of effective hourly instantaneous data used to calculate daily mean value,and are used to evaluate the quality of daily average PAR data.The long-term variation of daily average PAR in the Sub-Center for Atmosphere station from 2005to 2015 is presented in Figure 3.The spatial distributions of daily mean and standard deviation of PAR are shown in Figure 4(a)and 4(b)respectively.
| 图表编号 | XD0027539000 严禁用于非法目的 |
|---|---|
| 绘制时间 | 2017.03.01 |
| 作者 | 刘慧、唐利琴、胡波、刘广仁、王跃思、白帆、陈永福、程一松、杜娟、杜明武、高美荣、高新连、高永平、官有军、郭永平、韩建梅、韩军、何其华、姜峻、蒋正德、李国振、李猛、李小丽、李玉霖、林静慧、刘文杰、刘允芬、娄金勇、孟泽、乔田华、宋星宇、孙聃、孙维、王可琴、王克林、武传胜、徐浩、徐文婷、尹春梅、张法伟、张秀永、赵永芳、朱广伟、朱元骏 |
| 绘制单位 | 中国科学院大气物理研究所,大气边界层物理和大气化学国家重点实验室、兰州大学,大气科学学院、中国科学院大气物理研究所,大气边界层物理和大气化学国家重点实验室、成都信息工程大学,大气科学学院、中国科学院大气物理研究所,大气边界层物理和大气化学国家重点实验室、中国科学院大气物理研究所,大气边界层物理和大气化学国家重点实验室、中国科学院大气物理研究所,大气边界层物理和大气化学国家重点实验室、中国科学院水土保持研究所 |
| 更多格式 | 高清、无水印(增值服务) |
 提示:宽带有限、当前游客访问压缩模式


