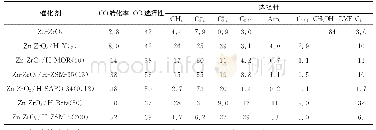
《Table 1 Catalytic performance of M/ZnO/Al2O3 catalysts (M=Ag, Cu, Au, and Pd) .》
 提示:宽带有限、当前游客访问压缩模式
本系列图表出处文件名:随高清版一同展现
《无表面活性剂条件下一锅法制备金属/氧化锌复合材料用于催化二氧化碳加氢制甲醇反应(英文)》
a The value refers to the recipe M/Zn ratio. Reaction conditions: 5 MPa of pressure,CO2/H2 = 1 : 3,gas flow = 15 mL·min-1,catalyst loading = 0.24 g.
A series of Pd/Zn molar ratios were investigated using this simple synthesis method.The final products were analyzed using ICP-MS to check the actual elemental compositions,as listed in Table S1(in Supporting Information).The detected atomic ratios of Pd/Zn are well consistent with the theoretical recipe value,evidencing a total conversion of initial Pd and Zn species to their corresponding products.It is quite advantageous to achieve a precise control of multi-component ratios by using this simple method.Fig.S1 shows XRD patterns of a series of Pd/ZnO composites with the Pd/Zn ratio varying from 1:2 to 1:48.As expected,when the ratio is reduced,the peak intensity ratio of Pd(111)/ZnO(002)decreases continually.At the same time,the widening of Pd(111)reveals a decreasing trend of the Pd size.According to the Scherrer formula,the particle size calculated on a basis of the Pd(111)peak goes up from 6.14 nm at Pd/Zn molar ratio=1:12 to 10.12 nm at Pd/Zn molar ratio=1:2.Fig.S2 shows TEM images of the Pd/ZnO samples.Despite different Pd loading,all composites show similar morphology,with small Pd dots on sphere-like ZnO crystals.All ZnO particles have similar size of around 30 nm,while the size of Pd particles varies with the Pd/Zn molar ratios,as shown in Fig.4a.When the Pd loading goes up,the corresponding Pd particle size also increases,in good agreement with aforementioned XRD analysis.This phenomenon may be attributed to relatively insufficient surface defects of ZnO to anchor extra Pd species,thus losing control of the growth of Pd particles.
| 图表编号 | XD0043331400 严禁用于非法目的 |
|---|---|
| 绘制时间 | 2019.02.15 |
| 作者 | 刘艳芳、胡兵、尹雅芝、刘国亮、洪昕林 |
| 绘制单位 | 武汉大学化学与分子科学学院、武汉大学化学与分子科学学院、武汉大学化学与分子科学学院、武汉大学化学与分子科学学院、武汉大学化学与分子科学学院 |
| 更多格式 | 高清、无水印(增值服务) |


