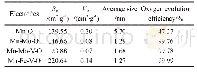
《Table 3 Average oxidation number of V in the VPO/SiO2catalysts》
 提示:宽带有限、当前游客访问压缩模式
本系列图表出处文件名:随高清版一同展现
《Influence of V/P Ratio on the Catalytic Performance of VPO/SiO_2 Catalysts for Ammoxidation of Chloro-Substituted Toluenes》
BET specific surface area and pore analysis of the catalysts were characterized by N2 adsorption and the data are summarized in Table 2.It can be seen from Table 2 that S exhibited the highest surface area(231m2/g)and pore volume(0.78 cm3/g)and dramatically decreased to around 150 m2/g and 0.50 cm3/g after VPO loaded.After reaction,the specific area of the samples decreased and pore diameter increased except VP130.In the fresh samples,the precursor did not decompose completely,and the well dispersed undecomposed VPO particles may be porous,which supply some excess specific surface area.After reaction,the undecomposed VPO particles decomposed and the porous structure disappeared,leading to the decrease of the specific surface area and the increase of the average pore diameter.The reason for the increase of specific area of VP130 after reaction is that some pores were completely blocked before reaction,and the pores reopened after reaction.
| 图表编号 | XD0043224100 严禁用于非法目的 |
|---|---|
| 绘制时间 | 2019.02.24 |
| 作者 | DONG Yanling、XU Longlong、ZHANG Zhenguo、LIU Wenhui、LI Xiongjian、ZHONG Yalan、HUANG Chi |
| 绘制单位 | State Key Laboratory of Advanced Technology for Materials Synthesis and Processing,Wuhan University of Technology、Tianhua Chemical Branch,Xi'an Sunward Aeromat Co.,Ltd.、Tianhua Chemical Branch,Xi'an Sunward Aeromat Co.,Ltd.、Sanjiang Chemical Factory of |
| 更多格式 | 高清、无水印(增值服务) |
