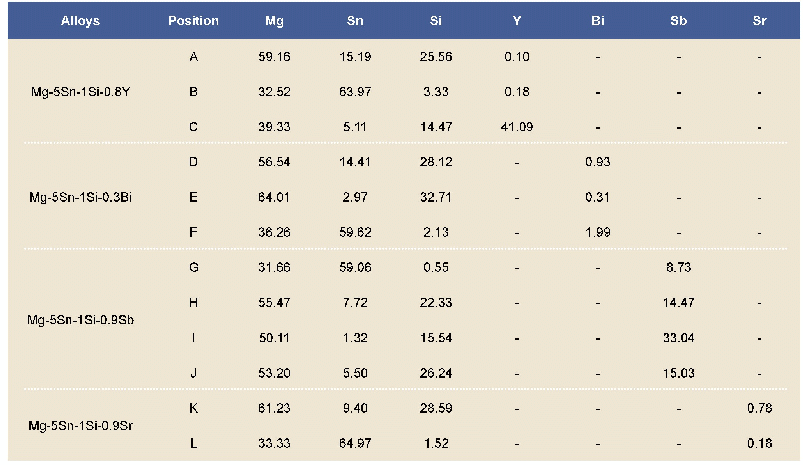
《Table S2 EDS results of SrTiO3 microcubes and Sr1–δTiO3 nanosheets》
 提示:宽带有限、当前游客访问压缩模式
本系列图表出处文件名:随高清版一同展现
《形貌可控及光学吸收性能可调的钙钛矿型SrTiO_3纳米结构的原位生长(英文)》
XRD measurement was carried out to investigate the structure/phase information of all PEO samples before(Fig.S3)and after(Fig.1)hydrothermal treatment.The(110)(101) and(111)peaks of TiO2 in rutile phase(JCPDS no.21-1276;a=b=0.495 nm,c=0.296 nm)at2θ=27.4?,36.1?and 41.2?can be clearly distinguished.In addition,a slight trace of(101)peak at 2θ=25.3?can also be detected,which originates from anatase phase TiO2(JCPDS no.21-1272;a=b=0.379 nm,c=0.951 nm).The coexistence of these two TiO2 phases in the PEO film coincides with the results of other groups[28].The diffraction peaks at 22.4?,40.0?and 46.5?for PEO films(Fig.S3)obtained under low concentration of Sr(AC)2(LSCE)match well with the(110)(111) and(200)lattice planes of SrTiO3(JCPDS no.35-0734;a=b=c=0.391 nm),which means that SrTiO3 has already been formed during the PEO process.However,these peaks of SrTiO3 in PEO film disappear under high concentration of Sr(AC)2(HSCE).This can be understood that the excessive Sr2+could lead to the sedimentation of phosphate radical and cause the weakening of micro-arc discharge.As a result,the crystallization of Sr species in PEO film is inhibited due to the lack of discharge energy.The Ti,Sr and O concentrations in PEO film are ascertained through EDS measurement(Table S1).That all samples contain a certain amount of Sr element although the SrTiO3 phase is not detected in the case of HSCE.A reasonable reason is that SrTiO3 exists in amorphous phase in PEO matrix.This assertion could be further verified from the diffraction dome in XRD pattern in the range of 23?-36?,which is in good agreement with the formation of amorphous tungstate fabricated by PEO method[23-24].
| 图表编号 | XD0043165300 严禁用于非法目的 |
|---|---|
| 绘制时间 | 2019.01.01 |
| 作者 | 刘小元、刘宝丹、姜亚南、王柯、周洋、杨兵、张兴来、姜辛 |
| 绘制单位 | 中国科学院金属研究所沈阳材料科学国家研究中心、中国科学技术大学材料科学与工程学院、中国科学院金属研究所沈阳材料科学国家研究中心、中国科学院金属研究所沈阳材料科学国家研究中心、中国科学院金属研究所沈阳材料科学国家研究中心、中国科学技术大学材料科学与工程学院、中国科学院金属研究所沈阳材料科学国家研究中心、中国科学技术大学材料科学与工程学院、中国科学院金属研究所沈阳材料科学国家研究中心、中国科学院金属研究所沈阳材料科学国家研究中心、中国科学院金属研究所沈阳材料科学国家研究中心 |
| 更多格式 | 高清、无水印(增值服务) |


