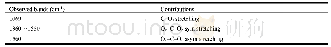
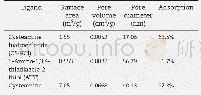
《Table 2.IR Spectrum Data of CO2 Adsorption on the CaO (001) Surface (cm-1) a》
 提示:宽带有限、当前游客访问压缩模式
本系列图表出处文件名:随高清版一同展现
《A DFT Study on the Adsorption of CO_2 Molecules on CaO(001) Surface at Different Coverages》
aOs and Oc are the oxygen atom from substrate surface and CO2,respectively.
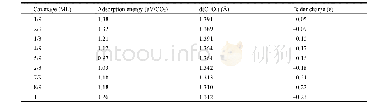
HREELS is a technology to measure the vibration frequency of surface adsorption bonds and to study the surface reaction mechanism.Fig.5 shows the simulated energy spectrum of the most stable adsorption models at different coverages.At low coverage(≤1/3 ML),the characteristic peaks are similar.There are strong peaks in the range of 900~1000 cm-1.It can be inferred that these peaks mainly come from the stretching vibration of newly formed C–Os.According to the above description(Table 1),the average bond length of C–Os shortens gradually with the growing coverage.Therefore,the peak blue-shifts correspondingly,as shown in Fig.5a~5c.The peak in the frequency of 890 cm-1 at the coverage of 1/9 ML blue shifts to 1030 cm-1 when the coverage is 1 ML.
| 图表编号 | XD0034853100 严禁用于非法目的 |
|---|---|
| 绘制时间 | 2019.01.01 |
| 作者 | 陈红、章永凡、李奕、黄淑萍、齐嘉媛、刘蓉 |
| 绘制单位 | College of Zhicheng, Fuzhou University、College of Chemistry, Fuzhou University、College of Chemistry, Fuzhou University、College of Chemistry, Fuzhou University、College of Chemistry, Fuzhou University、College of Chemistry, Fuzhou University、College of Mathe |
| 更多格式 | 高清、无水印(增值服务) |