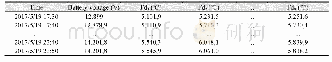
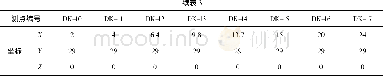
《Table 4 The continuous monitoring data of sap flow on May 19,2017(partly)》
 提示:宽带有限、当前游客访问压缩模式
本系列图表出处文件名:随高清版一同展现
《陇东黄土高原区人工刺槐林树干液流数据集(2017–2019)》
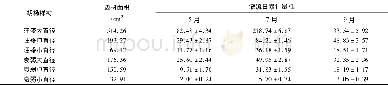
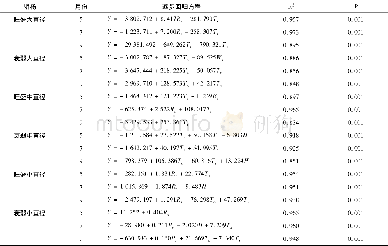
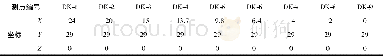
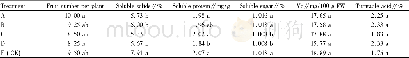
The data analysis in 2017 showed that:(1)there was a trend of high in the day and low in the night in the daily variation of sap flow of Robinia pseudoacacia forest;(2)the variation of sap flow rate of Robinia pseudoacacia forest was single peak in sunny days,multi peak(in cloudy days and irregular fluctuation in rainy days);(3)the monthly mean value of sap flow rate of Robinia pseudoacacia forest was low-high-low.The sap flow rate of Robinia pseudoacacia forest in October was the lowest(193.19 g·h–1),and that in August was the highest(652.31 g·h–1);(4)There were significant seasonal differences in the start time,peak time and decline time of sap flow in different growth periods.Generally,sap flow starts at about 7:00 in the early growth period and reaches the peak time at about 13:00,which is one hour behind the middle growth period.However,sap flow starts at 6:00 in the peak growth period and reaches the peak value at 11:00–12:00,and the law of change in the late growth period is basically the same as that in the early growth period;(5)the factors influencing sap flow were different in growth periods,but they were significantly related to air temperature,solar radiation and air humidity.Other factors have different effects on sap flow with seasonal changes.Table 4 is an excerpt of the continuous monitoring data of trunk sap flow on May 19,2017,in which Fd1 is the monitoring data of No.666 sample tree,Fd2 is the monitoring data of No.662 sample tree,Fd3 is the monitoring data of No.660 sample tree,Fd4 is the monitoring data of No.665 sample tree,Fd5 is the monitoring data of No.658 sample tree,Fd6 is the monitoring data of No.663 sample tree,Fd7 is the monitoring data of No.659sample tree,and Fd8 is the monitoring data of No.664 sample tree.
| 图表编号 | XD00153333600 严禁用于非法目的 |
|---|---|
| 绘制时间 | 2020.03.25 |
| 作者 | 张军、邸利、陈徵尼、王安民、倪帆、任艺彬、费俊娥、吴贤忠、王正安、韩芬、汝海丽、景贯阳 |
| 绘制单位 | 甘肃农业大学资源与环境学院、甘肃农业大学资源与环境学院、甘肃省林业科学研究院、平凉市水土保持科学研究所、甘肃农业大学资源与环境学院、陇东学院农林科技学院、甘肃农业大学资源与环境学院、兰州城市学院、宁夏农林科学院固原分院、平凉市水土保持科学研究所、平凉市水土保持科学研究所、甘肃农业大学资源与环境学院 |
| 更多格式 | 高清、无水印(增值服务) |