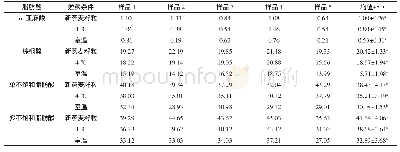
《Table 1 Fatty acid profi les (expressed as%TFA) under N-replete (N+) or N-deplete (N-) conditions a
 提示:宽带有限、当前游客访问压缩模式
本系列图表出处文件名:随高清版一同展现
《"Metabolic and physiological regulation of Chlorella sp.(Trebouxiophyceae, Chlorophyta) under nitrogen deprivation"》
Data are presented as mean±SD(n=3).Signifi cant diff erence between N+and N-conditions are indicated by asterisks(*P<0.05;**P<0.01).
To assess the metabolic diff erence at various time points,PCA and OPLS-DA model were used to discriminate the two sample groups(N+and N-)using the fi rst two principal components.Distinct clustering was observed in the data of day 2 and day 4(Fig.4).The parameters of R 2 X,R 2 Y and Q 2 revealed high discriminative and predictive stability of the model.From over a thousand features aligned in XCMS online,only 59 were selected and annotated using METLIN database based on statistical analysis(P<0.05,fold change>1.5)and their biological roles in Chlorella sp.Overall,the metabolites belonged to several classes,namely amino acids,lipids and fatty acids,nucleic acids,organic acid,phytochemical compounds,vitamins and cofactors.The heat map in Table 2 shows the fold change between N+and N-condition at day 1,2 and 4.The annotated metabolites were classifi ed using the KEGG BRITE mapping tool.
| 图表编号 | XD0034431500 严禁用于非法目的 |
|---|---|
| 绘制时间 | 2019.01.01 |
| 作者 | YONG Wai-Kuan、LIM Phaik-Eem、VELLO Vejeysri、SIM Kae-Shin、ABDUL MAJID Nazia、MUSTAFA Emienour Muzalina、NIK SULAIMAN Nik Meriam、LIEW Kan-Ern、CHEN Brenna Jia-Tian、PHANG Siew-Moi |
| 绘制单位 | Institute of Ocean and Earth Sciences, University of Malaya、Institute of Graduate Studies, University of Malaya、Institute of Ocean and Earth Sciences, University of Malaya、Institute of Ocean and Earth Sciences, University of Malaya、Institute of Biological |
| 更多格式 | 高清、无水印(增值服务) |
查看“Table 1 Fatty acid profi les (expressed as%TFA) under N-replete (N+) or N-deplete (N-) conditions at diff erent time poi”的人还看了
-

- 表1 两组产妇血和脐血中TFA绝对含量的比较 (g/L) Tab 1 Comparison of total fatty acid content between maternal and umbilical cord blood


