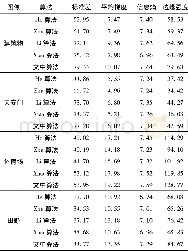
《Table 1 Comparison of debonding defects images》
 提示:宽带有限、当前游客访问压缩模式
本系列图表出处文件名:随高清版一同展现
《玻璃纤维蜂窝复合材料的太赫兹无损检测技术(英文)》
By extracting the debonding defect characteristics,selecting the same defect position(numbers 1to 10are as shown in Fig.10),and comparing the pixel values before and after the optimization,the image comparison as shown in Table 1can be obtained.
| 图表编号 | XD0032844900 严禁用于非法目的 |
|---|---|
| 绘制时间 | 2019.02.01 |
| 作者 | 张丹丹、任姣姣、李丽娟、乔晓利、顾健 |
| 绘制单位 | 长春理工大学光电工程学院光电测控技术研究所、长春理工大学光电工程学院光电测控技术研究所、长春理工大学光电工程学院光电测控技术研究所、长春理工大学光电工程学院光电测控技术研究所、长春理工大学光电工程学院光电测控技术研究所 |
| 更多格式 | 高清、无水印(增值服务) |
查看“Table 1 Comparison of debonding defects images”的人还看了
-

- 表1 不同方法下图像增强评价指标对比表Tab.1 Comparison table of image enhancement evaluation indicators under different methods
-

- 表2 5种去雾算法的复原图像质量客观指标比较Table 2Comparison of objective indexes of restored images'quality among five dehazing algorithms


