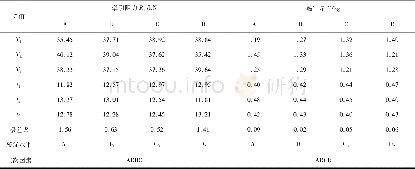
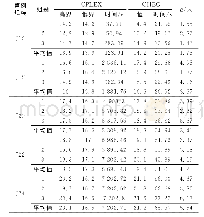
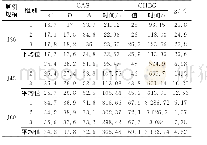
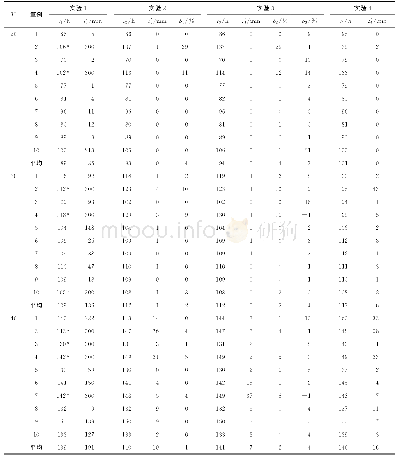
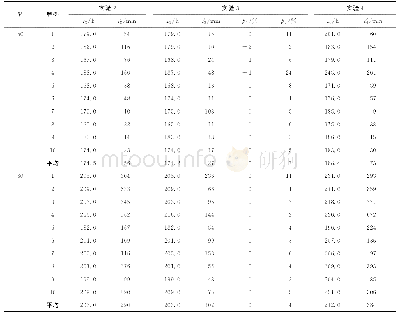
《Table 5 Results of numerical experiment》
 提示:宽带有限、当前游客访问压缩模式
本系列图表出处文件名:随高清版一同展现
《Berth-crane allocation under uncertainty:dynamic modeling and nested Tabu search》
Experiment results are shown in Table 5.The‘obj’column reports the object value of each method.The‘gap’column reports the gap between‘obj’value and 1.1‘obj’values.“*”means the low bound of Cplex,accuracy solution otherwise.And the average computing time of each scale is shown in Table 6.
| 图表编号 | XD0020604900 严禁用于非法目的 |
|---|---|
| 绘制时间 | 2018.12.01 |
| 作者 | 韩笑乐、Qian Lina、Lu Zhiqiang |
| 绘制单位 | School of Mechanical Engineering,Tongji University、School of Mechanical Engineering,Tongji University、School of Mechanical Engineering,Tongji University |
| 更多格式 | 高清、无水印(增值服务) |
