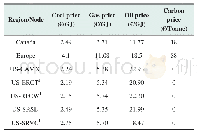
《Table 2 Overview fuel-and carbon pricing per region for the 2050 reference model.Applied exchange r
 提示:宽带有限、当前游客访问压缩模式
本系列图表出处文件名:随高清版一同展现
《Developing a global interconnected power system model》
1 The AEO incorporates region specific fuel prices for the different USregions depending on accessibility to fuels and regional policies.Pricing for other US nodes fall within the range of the above sample.
The 2050 generator portfolio for the US,nodal fuel pricing and total demand are based on the reference scenario of the 2017 AEO of the EIA[37,38].Compared to Europe,fuel prices in the AEO for coal and gas are significantly lower.An overview of fuel and carbon pricing for all regions can be seen in Table 2.Load profiles for different US nodes are developed by combining and scaling historical(mostly 2015)load profiles of the relevant balancing authorities(BA)within each node,as retrieved from the Federal Energy Regulatory Commission(FERC)[39].BA’s per node have been identified based on geographical visualizations from the EIA and FERC[40,41],and individual market reports of the BA’s.For this study it has been assumed that peak loads per node scale linearly with the overall increase in load between 2015 and2050.Due to a lack of available transmission capacity data for the US,net transfer capacities(NTC)between nodes have been determined by assuming that the maximum hourly flow between BAs during 2015 and 2016,as retrieved through EIA’s data plugin[42],can be seen as representative.
| 图表编号 | XD0020049700 严禁用于非法目的 |
|---|---|
| 绘制时间 | 2018.08.01 |
| 作者 | Maarten Brinkerink、Paul Deane、Seán Collins、Brian ó Gallachóir |
| 绘制单位 | MaREI Centre, Environmental Research Institute, University College Cork、School of Engineering, University College Cork、MaREI Centre, Environmental Research Institute, University College Cork、School of Engineering, University College Cork、MaREI Centre, Env |
| 更多格式 | 高清、无水印(增值服务) |
查看“Table 2 Overview fuel-and carbon pricing per region for the 2050 reference model.Applied exchange rate of€1–US$1.16 and€”的人还看了
-

- Table 2.projected changes over the src region under global warming of 1.5°c relative to the 1986–2005 baseline period an

![Table 2 Scheme of the strategy transformation regionalization for Ningxia ACD[16]](http://bookimg.mtoou.info/tubiao/gif/QQSJ201902008_06100.gif)


