《Table 1.Cyclone number, intensity and CAI values globally and for the four regions.The percentage o
 提示:宽带有限、当前游客访问压缩模式
本系列图表出处文件名:随高清版一同展现
《Role of Extratropical Cyclones in the Recently Observed Increase in Poleward Moisture Transport into the Arctic Ocean》
Measuring the number of cyclones across 55?–65?N also demonstrates a clear regional distribution(Table 1).Annually,an average of 207 cyclones cross the latitudes of55?–65?N,of which 66(32%)cyclones are from the North Atlantic region and 57(27%)from Eurasia.North America presents the smallest number with 37(18%)cyclones,and the remaining 47(23%)are from the North Pacific.The total cyclone number across 55?–65?N demonstrates an upward trend before 1971 and a downward trend after 1971,as indicated by the change-point analysis(Fig.2).Similar to Zhang et al.(2004),the cyclone number in the North Pacific region exhibits a downward trend throughout both periods,which helps promote Eurasia to become a bigger contributor than the North Pacific(Table 1).In addition,Eurasia also presents the largest upward trend in cyclone number amongst all the regions for the first period.
| 图表编号 | XD0015816900 严禁用于非法目的 |
|---|---|
| 绘制时间 | 2018.01.10 |
| 作者 | Gian A.VILLAMIL-OTERO、Jing ZHANG、Juanxiong HE、Xiangdong ZHANG |
| 绘制单位 | Department of Physics,North Carolina A&T State University、Department of Physics,North Carolina A&T State University、Department of Energy and Environmental Systems,North Carolina A&T State University、Institute of Atmospheric Physics,Chinese Academy of Scie |
| 更多格式 | 高清、无水印(增值服务) |
查看“Table 1.Cyclone number, intensity and CAI values globally and for the four regions.The percentage of the global total is”的人还看了
-

- Table 1 Trough values and trough separations of the opti-cal intensity changing with locations of the droplets
-
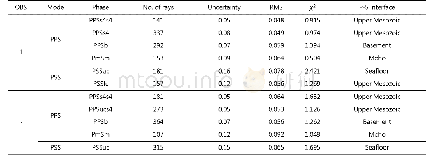
- Table 2.Numbers of picks, picking errors, RMS misfits, χ2 values, conversion mode and conversion interface (P-S interfac
-
- Table 2.Numbers of picks, picking errors, RMS misfits, χ2 values, conversion mode and conversion interface (P-S interfac


