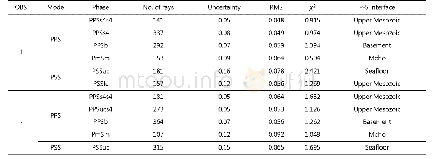
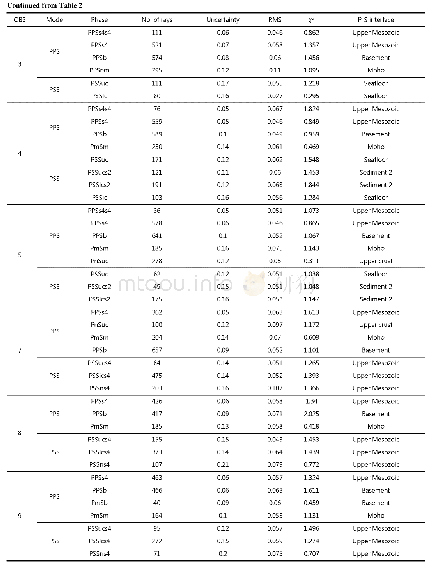
《Table 2.Numbers of picks, picking errors, RMS misfits, χ2 values, conversion mode and conversion in
 提示:宽带有限、当前游客访问压缩模式
本系列图表出处文件名:随高清版一同展现
《Crustal S-wave velocity structure across the northeastern South China Sea continental margin: implications for lithology and mantle exhumation》
To confirm the conversion mode,we calculated the apparent velocities of several converted phases in OBS09(Table 1).Usually,the S-wave phases of the PPS mode have the same or smaller apparent velocities as the corresponding P-wave phases,while the S-wave phases of the PSS mode have much smaller apparent velocities.The apparent velocity of PPSs4 phases is 5.17 km/s,close to the apparent velocity of Pg phases,but for the PSSucs4 phases the apparent velocity is 2.88 km/s,much smaller than Pg phase velocity of 5.64 km/s(Table 1).If we further compare vertical with radial components(Figure 9),we can see that the PPSs4 phases have the same offset with Pg phases,but shorter travel times while the PSSucs4 phases have smaller offsets and longer trave times.After confirming the conversion mode,the modeling exercise was then performed from sediment to mantle at each station by repeatedly changing the Poisson’s ratio and converting interfaces until all the calculated arrivals fit well with picked phases Then,all of the S-wave phases are assigned to the suitable interfaces.
| 图表编号 | XD0056559500 严禁用于非法目的 |
|---|---|
| 绘制时间 | 2019.07.01 |
| 作者 | WenAi Hou、Chun-Feng Li、XiaoLi Wan、MingHui Zhao、XueLin Qiu |
| 绘制单位 | Institute of Marine Geology and Resources, Zhejiang University、Institute of Marine Geology and Resources, Zhejiang University、Laboratory for Marine Mineral Resources, Qingdao National Laboratory for Marine Science and Technology、State Key Laboratory of Ma |
| 更多格式 | 高清、无水印(增值服务) |
