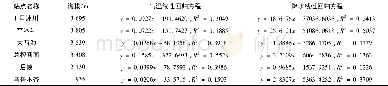
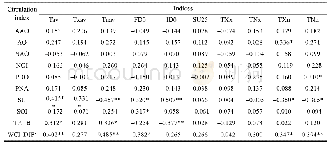
《Table 1.Linear regression between SOS and spring temperature at17 stations.Triple, double and singl
 提示:宽带有限、当前游客访问压缩模式
本系列图表出处文件名:随高清版一同展现
《Changing Spring Phenology Dates in the Three-Rivers Headwater Region of the Tibetan Plateau during 1960–2013》
Of all stations,17,or 61%(Fig.1),show a significant(P<0.1)linear relationship between SOS and the optimal pre-season Tmin.Thus,for these 17 stations,the SOS time series are reconstructed on the basis of the optimal pre-season temperature and regression coefficient a(Table 1),using the method described in section 2.2.3.
| 图表编号 | XD0015817000 严禁用于非法目的 |
|---|---|
| 绘制时间 | 2018.01.10 |
| 作者 | Shuang YU、Jiangjiang XIA、Zhongwei YAN、Kun YANG |
| 绘制单位 | Key Laboratory of Regional Climate-Environment for East Asia,Institute of Atmospheric Physics,Chinese Academy of Sciences、University of Chinese Academy of Sciences、Key Laboratory of Regional Climate-Environment for East Asia,Institute of Atmospheric Physi |
| 更多格式 | 高清、无水印(增值服务) |
