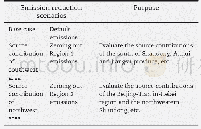
《Table 2–Scenarios designed for the study of contributions from regional sources.》
 提示:宽带有限、当前游客访问压缩模式
本系列图表出处文件名:随高清版一同展现
《Process analysis of PM_(2.5) pollution events in a coastal city of China using CMAQ》
Fig.3 shows the time variations of the observed and simulated temperature at 2 m(T2),relative humidity at 2 m(RH2),wind speed at 10 m(WSPD10)and wind direction at 10 m(WDIR10)in Qingdao during December 11,2015 January 6,2016 and December 12,2016 January 6,2017 at 12 km grid resolution.Table 3 summarizes the performance statistics of T2,RH2,WSPD10 and PM2.5.The temporal variations and magnitudes of T2 were well consistent with the observation,with the correlation coefficient of 0.9 and NMB of 39.4%during two winters(December 11,2015–January 6,2016 and December 12,2016–January 6,2017).WRF also gave out relatively good performance of RH2 except slightly overestimation during several hours(e.g.December 15–16,2015),and the correlation coefficient and NMB of RH2 are 0.7 and 0.2%,respectively.Although the variation trend of the wind speed was well reproduced,the positive bias were sometimes occurred.From the statistics results,the correlation coefficient between the simulated and observed wind speed is 0.8,while the NMB is25.0%.
| 图表编号 | XD0052059600 严禁用于非法目的 |
|---|---|
| 绘制时间 | 2019.05.15 |
| 作者 | Qiang Zhang、Di Xue、Xiaohuan Liu、Xiang Gong、Huiwang Gao |
| 绘制单位 | College of Environmental Science and Engineering, Ocean University of China、College of Environmental Science and Engineering, Ocean University of China、College of Environmental Science and Engineering, Ocean University of China、Key Laboratory of Marine En |
| 更多格式 | 高清、无水印(增值服务) |
查看“Table 2–Scenarios designed for the study of contributions from regional sources.”的人还看了
-

- Table 2.contribution percentages of the pm2.5 mass concentra-tion to Beijing from several regions against different air
-

- Table 1“Participants,Intervention,Comparison,Outcome and Study Design”approach for the selection of clinical studies fol
-

- Table 1General characteristics of the MAGs retrieved in the present study from Guaymas Basin hydrothermal sediments.


