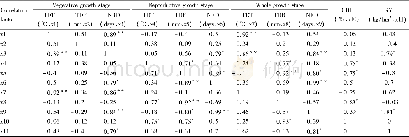
《Table 2.Ratios between observed and simulated crop yields under different ranges of the Standardize
 提示:宽带有限、当前游客访问压缩模式
本系列图表出处文件名:随高清版一同展现
《Introducing a drought index to a crop model can help to reduce the gap between the simulated and statistical yield》
Note:SD,Standard deviation.
The spatial boundaries of the HHH Plain(Figure S1)were acquired from Liu et al.(2015).The spatial distribution of croplands was computed on the basis of the National Land Cover Data Sets of China,as developed from Landsat TM digital images in approximately 2000(Liu et al.2003).The agricultural model,Agro-C(Text S1),was used to model the yields of the winter wheat and summer maize system in the HHH Plain from 1991to 2010 on a county scale.We selected the Agro-C model because it was developed based on observations conducted in China’s agro-ecosystems and has been frequently and successfully used to quantify agricultural production and carbon and nutrient dynamics at both regional and national scales in China(Huang et al.2009;Wang et al.2014;Zhang et al.2017).A description of the spatial model inputs for Agro-C,such as climatic and edaphic conditions,as well as the agricultural management and crop phenology data,are also presented in Text S1.A yearly county-level database(Huang and Tang 2010)including the annual cultivation acreage and yield for each crop in China was used to determine the annual statistical crop yields of both winter wheat and summer maize in the HHH Plain over the study period.These statistical yield data were used to adjust the model simulated yield,based on the drought condition as characterized by the Standardized Precipitation Evapotranspiration Index(SPEI).We chose SPEI because it has been proved to be advantageous for drought monitoring in northern China owing to its multiscalarity and effective characterization of agricultural droughts(Wang et al.2016).The R SPEI package(http://cran.r-project.org/web/packages/SPEI)was used to compute the monthly SPEI for wheat and maize growing seasons,and the evolution of cumulative moisture conditions from 1-to 12-month lags was selected to identify the impact of the SPEI interannual variability on crop yield(Potopováet al.2015).In general,drought occurs when the SPEI value is negative;and the smaller the SPEI,the higher the drought intensity(Table 1).
| 图表编号 | XD00187337600 严禁用于非法目的 |
|---|---|
| 绘制时间 | 2018.07.16 |
| 作者 | WANG Guo-Cheng、ZHANG Qing、XU Jing-Jing |
| 绘制单位 | LAPC, Institute of Atmospheric Physics, Chinese Academy of Sciences、LAPC, Institute of Atmospheric Physics, Chinese Academy of Sciences、LAPC, Institute of Atmospheric Physics, Chinese Academy of Sciences |
| 更多格式 | 高清、无水印(增值服务) |
查看“Table 2.Ratios between observed and simulated crop yields under different ranges of the Standardized Precipitation Evapo”的人还看了
-

- 表2 有雪和无雪覆盖条件下土壤温度的模拟精度Table 2 Evaluation indexes betw een observed and simulated soil temperatures w ith or w ithout sno


