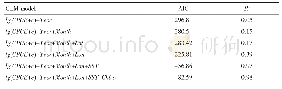
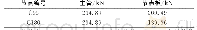
《Tab.2 AIC of the step-wise GLM》
 提示:宽带有限、当前游客访问压缩模式
本系列图表出处文件名:随高清版一同展现
《Response of Spatio-temporal Distribution of Fishery Resources to Mairne Environment in the Northern South China Sea》
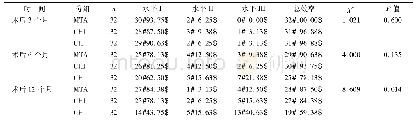
Before standardization,CPUE was carried out logarithmic transformation to make it basically conform to the normal distribution(Fig.2).The Stepwise regression method of R software was applied to construct GLM model with AIC value as the screening factor,and R2represented the degree that the predictive variable interpreted the response variable.The results showed that the AIC value of the model decreased when the factors of Year,Month,Lon,SST and Chl a were introduced,which could explain 98%of the change of CPUE(Tab.2).
| 图表编号 | XD00183486700 严禁用于非法目的 |
|---|---|
| 绘制时间 | 2018.12.01 |
| 作者 | Liu Zhunan、Yu Jing |
| 绘制单位 | Guangdong Engineering Technology Research Center of Marine Recreational Fishery、Key Laboratory of Marine Ranching Technology,CAFS、College of Marine Science, Shanghai Ocean University、Guangdong Engineering Technology Research Center of Marine Recreational |
| 更多格式 | 高清、无水印(增值服务) |