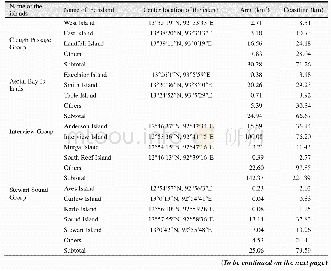
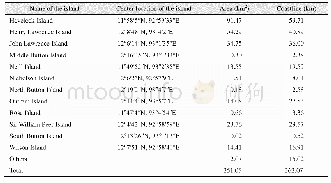
《Table 1.Evidence supporting APE and the crack-critical New Geophysics (after Crampin and Gao Y, 201
 提示:宽带有限、当前游客访问压缩模式
本系列图表出处文件名:随高清版一同展现
《Evidence supporting New Geophysics》
*Without innumerable special cases.References:[1]Crampin(1994,1999);[2]Crampin and Peacock(2008);[3]Crampin and Zatsepin(1997);[4]Angerer et al.(2002);[5]Crampin et al.(2002);[6]Crampin et al.(2004a);[7]Volti and Crampin(2003);[8]Crampin et
An additional distinctive feature is also observed and modelled.Following the high-pressure CO2-injection,the time-delays between the top and bottom of the injection zone are now 204ms for S1 and 184 ms for S2,showing that after the high-pressure injection the S2-wave has become the faster SWS phase.There has been what Angerer et al.(2002)call a‘90°-flip’in shear-wave polarisations.Such flips have also been observed in a walk-away vertical-seismic-profile in a high-pressure Caucasus reservoir(Crampin et al.,1996),and immediately above swarms of small earthquakes when the shear-waves pass though the high-fluidpressure envelopes surrounding all seismically-active faults(Crampin et al.,2002,2003,2004a).Thus APE identifies and models an unexpected feature of the effects of critically high-pressure pore-fluids in hydrocarbon reservoirs,and earthquake fault monitoring,which provide strong support for the validity of New Geophysics.These phenomena match properties P2 Monitorability,P3Uniformity,P4 Calculability,and P5 Predictability in Table S1.
| 图表编号 | XD0015933700 严禁用于非法目的 |
|---|---|
| 绘制时间 | 2018.05.01 |
| 作者 | Stuart Crampin、Yuan Gao |
| 绘制单位 | British Geological Survey,The Lyell Centre、School of Geo Sciences,University of Edinburgh EH9 3FW、Institute of Earthquake Forecasting,China Earthquake Administration |
| 更多格式 | 高清、无水印(增值服务) |


