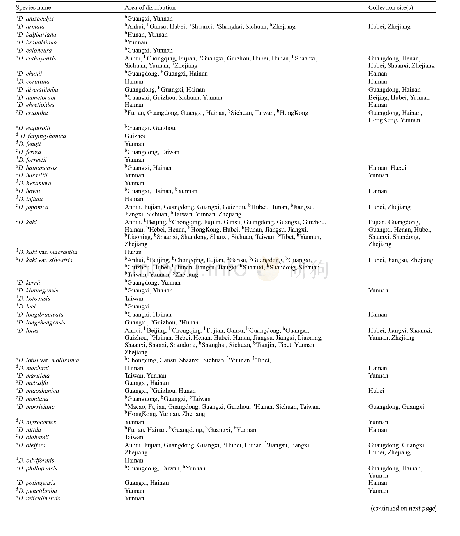
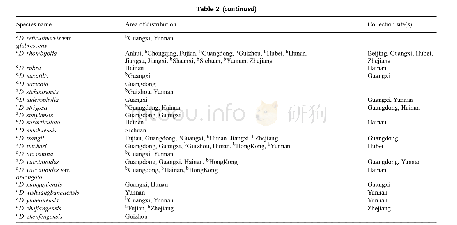
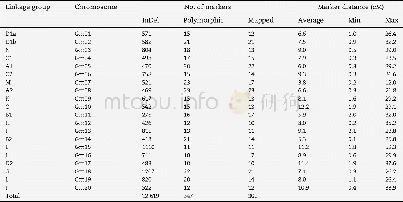
《Table 2–Statistics of the BA map based on In Del markers.》
 提示:宽带有限、当前游客访问压缩模式
本系列图表出处文件名:随高清版一同展现
《Development and validation of InDel markers for identification of QTL underlying flowering time in soybean》
A total of 347 polymorphic markers were scored in the genotype analysis of 156 progeny in the BA F2population,with each primer pair yielding polymorphic bands at a single locus.After exclusion of 47 unlinked markers,300 marker loci were grouped into 20 LGs,which matched the 20 consensus LGs.Finally,a genetic map(Fig.1),designated as the BA map,was constructed with 20 LGs covering a total genetic distance of2347.30 c M with an average density of one marker for every7.82 c M(Table 2).The number of mapped markers per LG ranged from 10(H and D2)to 23(A2)with an average of 15markers.The largest and smallest genetic distances between adjacent markers were 52.3 c M and 0.1 c M,respectively.Because of low marker density(Fig.2)and infrequent recombination compared with distal regions,our map did not cover all centromeric blocks,resulting in coverage of only a portion of some chromosomes(N,C2,M,O,H,and F)or of two clusters of markers,one from each arm(K and B1)in the F2mapping study.Six marker orders(N,A1,M,B2,and E)in our genetic map that were in conflict with the physical map could be due to sequence assembly errors,inversions,and segregation distortion.
| 图表编号 | XD0012314900 严禁用于非法目的 |
|---|---|
| 绘制时间 | 2018.04.01 |
| 作者 | Jialin Wang、Lingping Kong、Kanchao Yu、Fengge Zhang、Xinyi Shi、Yanping Wang、Haiyang Nan、Xiaohui Zhao、Sijia Lu、Dong Cao、Xiaoming Li、Chao Fang、Feifei Wang、Tong Su、Shichen Li、Xiaohui Yuan、Baohui Liu、Fanjiang Kong |
| 绘制单位 | The Key Laboratory of Soybean Molecular Design Breeding, Northeast Institute of Geography and Agroecology, Chinese Academy of Sciences、The Key Laboratory of Soybean Molecular Design Breeding, Northeast Institute of Geography and Agroecology, Chinese Acade |
| 更多格式 | 高清、无水印(增值服务) |
查看“Table 2–Statistics of the BA map based on In Del markers.”的人还看了
-
- 表2 基于基元类型的SSRs在意蜂幼虫肠道转录组中的出现频率Table 2 Frequency distribution of SSRs based on the motif types in A.m.ligustica larval gu
-
- Table 3 Statistics on the shifting trend in the spring phenophase of eight typical deciduous broad-leaved woody plants i
-
- Table 1 Metadata summary of“Dataset of urban development level in the Taihu Lake basin based on nighttime light images(2
-
- Table 13 Statistics of the Capacity Building in 100 Universities Program on Global Change Research Data Publishing&Shari


