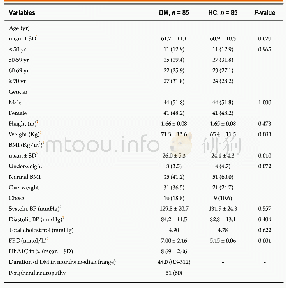
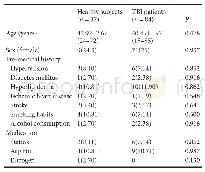
《Table 1 Demographic and clinical characteristics of the study groups based on the diagnosis in 168
 提示:宽带有限、当前游客访问压缩模式
本系列图表出处文件名:随高清版一同展现
《Bruch's membrane opening-minimum rim width and visual field loss in glaucoma:a broken stick analysis》
aMann-Whitney U test;bχ2 test;cStudent’s t-test.VF:Visual field;VFI:Visual field index.
One hundred sixty-eight participants(85 normal and 83 glaucoma subjects)were enrolled in the study.The demographic,clinical,and ocular characteristics of the participants are summarized in Table 1.The global BMO-MRW of the glaucoma patients was significantly thinner than that of the normal subjects,256.3±48.9μm for the normal subjects and 163.8±37.9μm for the glaucoma patients(P<0.001).The number of glaucoma patients whose sectoral BMO-MRW values followed the ISNT rule was significantly lower than the normal subjects,with 31(36.5%)for the normal subjects and 3(3.6%)for the glaucoma patients(P<0.001;Table 2).The global indices of the VF for glaucoma patients were significantly worse than the normal subjects.The VF MD was-1.22±1.91 d B for the normal subjects and-7.06±5.38 d B for glaucoma patients(P<0.001).Scatterplots of the global,sectoral BMO-MRWs and corresponding VF TD values are shown in Figures 2 and 3.A range of BMO-MRW values was unrelated to the VF TD values,followed by a range of BMO-MRW values which was strongly related to the VF TD values(Figure 2A).Statistically optimal locations of the tipping points between these two ranges in the global and sectoral BMO-MRW values are summarized in Table 3.The locations of the tippingpoints were statistically significant for all of the locations(all P≤0.006;Davies’test).The percentages of BMO-MRW loss for the tipping points were calculated for the global and sectoral BMO-MRW values using the mean BMO-MRW values for the normal subjects.The tipping point for the global BMO-MRW measurement occurred after a 25.9%loss from the mean normal BMO-MRW value.Using sectoral analyses,the percentage of BMO-MRW loss was highest for the superonasal sector(34.9%)and was lowest loss for the temporal sector(6.6%),with a range of 8.9%-34.4%for all of the other sectors(Table 3).
| 图表编号 | XD0023061500 严禁用于非法目的 |
|---|---|
| 绘制时间 | 2018.05.18 |
| 作者 | Keun-Heung Park、Ji-Woong Lee、Jin-Mi Kim、Kouros Nouri-Mahdavi、Joseph Caprioli |
| 绘制单位 | Department of Ophthalmology,Pusan National University College of Medicine、Department of Ophthalmology,Pusan National University College of Medicine、Biomedical Research Institute,Pusan National University Hospital、Department of Biostatistics,Clinical Trial |
| 更多格式 | 高清、无水印(增值服务) |
