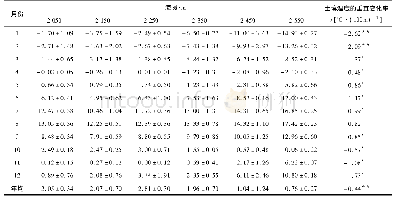
《Table 1.The increasing trends (unit:°C per decade) in annual mean SAT calculated using different me
 提示:宽带有限、当前游客访问压缩模式
本系列图表出处文件名:随高清版一同展现
《Evaluating the contributions of urban surface expansion to regional warming in Shanghai using different methods to calculate the daily mean temperature》
The increasing trends in annual mean SAT with daily mean values calculated using different methods for EX1 and EX2and the relative contributions of urban-related warming over the subregions of Shanghai(i.e.,areas that are defined as urban for both time periods (U2U),areas that are transformed from nonurban to urban(N2U),and urban areas(including U2U and N2U)) and Shanghai as a whole are shown in Table 1.For EX1,the changing trends calculated using Txnwere close to those using T4and T8(Zhao and Wu2018)over different subregions of Shanghai and Shanghai as a whole.However,for EX2,the changing trends using T4were smaller than those using Txnand T8,with the exception of those over U2U areas.As a result,the relative contributions of urban surface expansion to regional warming revealed similar values when using T8and Txn,while the smallest values occurred when using T4,with the exception of trends over U2U areas,where the contributions using T8and Txnwere smaller than those using T4.
| 图表编号 | XD00883900 严禁用于非法目的 |
|---|---|
| 绘制时间 | 2018.11.16 |
| 作者 | ZHAO De-Ming、WU Jian |
| 绘制单位 | CAS Key Laboratory of Regional Climate–Environment for Temperate East Asia, Institute of Atmospheric Physics, Chinese Academy of Sciences、Department of Atmospheric Science, Yunnan University |
| 更多格式 | 高清、无水印(增值服务) |
查看“Table 1.The increasing trends (unit:°C per decade) in annual mean SAT calculated using different methods (T4, T8, and Tx”的人还看了
-

- Table 1 The percentage of language use of the Singapore Chinese in different communicative contexts (%)
-

- 表2 长白山西坡苔原带各海拔的土壤月均温和年均温Table 2M onthly and annual mean soil temperatures at different altitudes in the alpine tundra on


