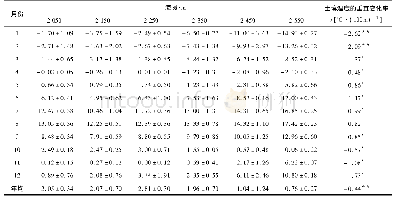
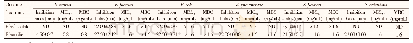
《Table 1Observed annual and seasonal mean surface ozone concentrations and trends in the SH over 199
 提示:宽带有限、当前游客访问压缩模式
本系列图表出处文件名:随高清版一同展现
《Surface and tropospheric ozone trends in the Southern Hemisphere since 1990: possible linkages to poleward expansion of the Hadley circulation》
a) Mean surface ozone concentrations ± standard deviations are in unit of ppbv,trends ± 90% confidence level are in unit of ppbv aà1,and*denotes statistically significant trends(P < 0.1). b) The largest seasonal trend for each site. c) Standard devi
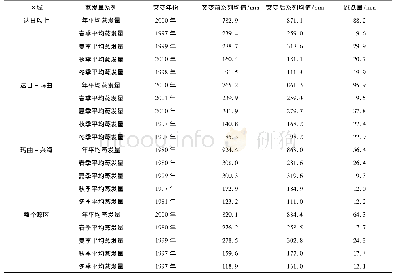
We summarize here available in situ measurements of tropospheric ozone at locations that have more than 15-year valid records over the period of 1990–2015 in the SH.Hourly surface ozone measurements are assessed from the World Data Center of Greenhouse Gas(WDCGG;https://gaw.kishou.go.jp/,with monthly data available from the Tropospheric Ozone Assessment Report (TOAR)at https://doi.org/10.1594/PANGAEA.876108) and contributed by McClure-Begley et al.[15].In order to derive a statistically robust trend,we apply the following criteria to select the sites:(1)have at least 18 hourly observations per day for calculating the daily mean.(2)Have at least 18 daily observations per month for calculating the monthly mean.(3)Have at least 2monthly observations for calculating the seasonal mean,and at least 8 months for the annual mean.(4)Have at least 16 annual mean observations for the period of 1990–2015.Nine surface sites in the SH meet these criteria and are used for our trend analyses as listed in Table S1(online).
| 图表编号 | XD0036052200 严禁用于非法目的 |
|---|---|
| 绘制时间 | 2019.03.30 |
| 作者 | Xiao Lu、Lin Zhang、Yuanhong Zhao、Daniel J.Jacob、Yongyun Hu、Lu Hu、Meng Gao、Xiong Liu、Irina Petropavlovskikh、Audra McClure-Begley、Richard Querel |
| 绘制单位 | Laboratory for Climate and Ocean-Atmosphere Studies, Department of Atmospheric and Oceanic Sciences, School of Physics, Peking University、School of Engineering and Applied Sciences, Harvard University、Laboratory for Climate and Ocean-Atmosphere Studies, D |
| 更多格式 | 高清、无水印(增值服务) |
