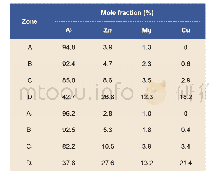
《Table 1.Apparent velocities and phases in the record of OBS09》
 提示:宽带有限、当前游客访问压缩模式
本系列图表出处文件名:随高清版一同展现
《Crustal S-wave velocity structure across the northeastern South China Sea continental margin: implications for lithology and mantle exhumation》
A statistical measure of fit in chi-squared(χ2)close to one is used to evaluate the mismatch between observed and calculated travel times(Zelt and Smith,1992).After the S-wave modeling,the fitting RMS errors are less than 200 ms andχ2 are less than 2for most of the S-wave phases(Table 2).The ray coverage map(Figure 7c)of all observed arrival locations further shows that the crust and most interfaces are well covered by 10–40 times,indicating high reliability and resolution of our S-wave model.
| 图表编号 | XD0056558800 严禁用于非法目的 |
|---|---|
| 绘制时间 | 2019.07.01 |
| 作者 | WenAi Hou、Chun-Feng Li、XiaoLi Wan、MingHui Zhao、XueLin Qiu |
| 绘制单位 | Institute of Marine Geology and Resources, Zhejiang University、Institute of Marine Geology and Resources, Zhejiang University、Laboratory for Marine Mineral Resources, Qingdao National Laboratory for Marine Science and Technology、State Key Laboratory of Ma |
| 更多格式 | 高清、无水印(增值服务) |
查看“Table 1.Apparent velocities and phases in the record of OBS09”的人还看了
-

- Table 4.Average ice thickness, temperature, and wind velocity in each period of wire icing at the two heights.


