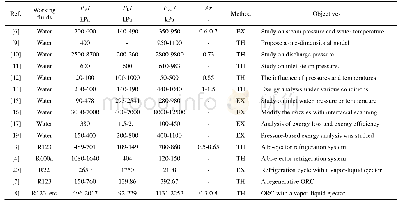
《Table 2 Dependence of water vapor amount on N2 (2) flow and bath temperature》
 提示:宽带有限、当前游客访问压缩模式
本系列图表出处文件名:随高清版一同展现
《Experimental Study on the Characteristics of Water Vapor Generation from Gas-washing Bottle and Injector》
*Water vapor flow by assuming that the outflow stream is saturated;**measured by the Temperature and humidity instrument;***the ratio of measured water vapor and saturation carrying capacity.
The results in Table 2 also suggest that,with the increasing N2(2)flow rate,the amount of moisture carried increases,and the relative moisture content also increases.However,this observation is not comparable for different gas-washing bottles.In experiment,two gas-washing bottles from the same manufacturer have been used,but the results are distinctively different.The water vapor generated in 2#bottle(i.e.the data in Table 2)increases with the increasing N2(2)flow rate,whilst the water vapor generated in 1#bottle is smaller.The porous media installed in gas-washing bottle determining the size and amount of bubbles created might be the reason.Good mass transfer prefers small bubbles in large quantities.The better the mass transfer,the more water vapor carried away.In experiment,the difference of bubbles created in difference bottles could be identified even by naked eyes.
| 图表编号 | XD0039672000 严禁用于非法目的 |
|---|---|
| 绘制时间 | |
| 作者 | WANG Zhipeng、WANG Lang、ZHAO Angran、CHENG Shuhao、YANG Ruiming、ZHUOYuqun、TONG Huiling |
| 绘制单位 | Key Laboratory for Thermal Science and Power Engineering of Ministry of Education, Department of Energy and Power Engineering, Tsinghua University、Key Laboratory for Thermal Science and Power Engineering of Ministry of Education, Department of Energy and |
| 更多格式 | 高清、无水印(增值服务) |


