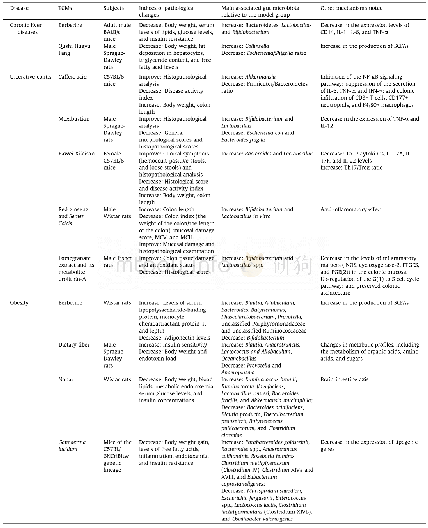
《Table 2 Relationships among variables of latitude, forest structural and functional attributes and
 提示:宽带有限、当前游客访问压缩模式
本系列图表出处文件名:随高清版一同展现
《"Forest biodiversity, relationships to structural and functional attributes, and stability in New England forests"》
Note:p values from the F-test show that all regression models are statistically significant,given a significance level of 0.01.The values with bold fonts show the highest R2coefficient of determination among the fitted regression curves in a group of the
Along the latitudinal gradient,Species Diversity decreases significantly(P<<0.01)from south to north(i.e.from lower latitudes towards higher latitudes,see Table 2)although there is some evidence of higher than expected diversity in northern Vermont and southern Massachusetts(Fig.3a).The numbers of species(Species Richness)in latitudinal bands are affected by sampling areas(or numbers of plots)in latitudinal bands.Because of different shapes and areas of different New England states,the sizes of latitudinal bands are different among them.Land-use(percentage of land in forest)also varies but usually there are more sampling plots and sampled areas in latitudinal bands with greater area(Fig.2).There is a linear relationship between Species Diversity and Species Richness in latitudinal bands(Fig.3b).
| 图表编号 | XD003826400 严禁用于非法目的 |
|---|---|
| 绘制时间 | 2018.06.01 |
| 作者 | Yude Pan、Kevin McCullough、David Y. Hollinger |
| 绘制单位 | USDA Forest Service、USDA Forest Service、USDA Forest Service |
| 更多格式 | 高清、无水印(增值服务) |
查看“Table 2 Relationships among variables of latitude, forest structural and functional attributes and biodiversity indices”的人还看了
-

- Table 1 Analysis of variability of soil moisture content with time (natural ecological forest and windbreak)


