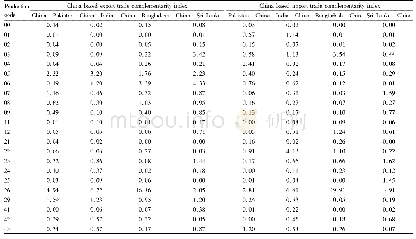
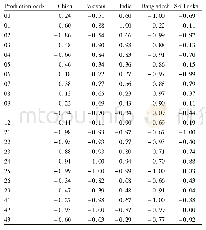
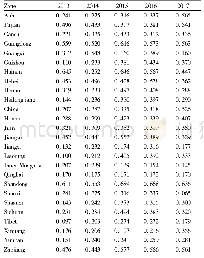
《Table 1 Statistical indicators of agricultural and livestock products trade flows》
 提示:宽带有限、当前游客访问压缩模式
本系列图表出处文件名:随高清版一同展现
《基于生态承载力视角的中国与“一带一路”国家农牧产品贸易流特征(英文)》
For example,China’s overload rates were 185%in 2005,253%in 2010,and 280%in 2014.Compared with the changes in the ecological overload situations of the“Belt and Road”countries,the overload rates of most countries in eastern,central,southern,and western Asia and north Africa increased,while the surplus rates of Russia and Mongolia in northeastern Asia and Bhutan,Laos,and Myanmar in southeast Asia all decreased.Thailand and the Philippines have reduced their overload rates,while most of the remaining countries in Southeast Asia have increased their overload rates.The ecological carrying capacity of central and eastern Europe is relatively good,because most countries there have reduced the overload rate:e.g.,Bulgaria and Romania have changed from overload to surplus,and Estonia and Latvia’s surplus rates have increased.
| 图表编号 | XD003630200 严禁用于非法目的 |
|---|---|
| 绘制时间 | 2019.11.30 |
| 作者 | 靳茗茗、徐增让 |
| 绘制单位 | 中国科学院地理科学与资源研究所、中国科学院大学、中国科学院地理科学与资源研究所 |
| 更多格式 | 高清、无水印(增值服务) |
查看“Table 1 Statistical indicators of agricultural and livestock products trade flows”的人还看了
-

- Table 6 Complementarity index of agricultural products trade between of China and four South Asian countries in 2016
-

- Table 3 The TII of agricultural products trade between China and four South Asian countries in 2006-2016


