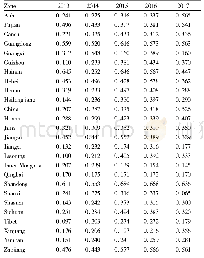
《Table 2 Results of agricultural total factor productivity in 27 provinces during 2013 and 2017》
 提示:宽带有限、当前游客访问压缩模式
本系列图表出处文件名:随高清版一同展现
《Agricultural Total Factor Productivity and Income Gap between Urban and Rural Residents——An Empirical Study Based on Provincial Panel Data》
Obtainedαi=0.75 andβi=0.25.Then,according to ,then calculated the total factor productivity of 27 provinces in China during 2013-2017,and the specific results are listed in Table 2.
| 图表编号 | XD00182638700 严禁用于非法目的 |
|---|---|
| 绘制时间 | 2018.11.01 |
| 作者 | Chen CHEN |
| 绘制单位 | International College of Jiangxi University of Finance and Economics |
| 更多格式 | 高清、无水印(增值服务) |


