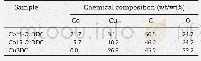
《Table 1–Weight percent of chemical compositions obtained from EDS technique of the synthesized mate
 提示:宽带有限、当前游客访问压缩模式
本系列图表出处文件名:随高清版一同展现
《Effect of Co(Ⅱ) dopant on the removal of Methylene Blue by a dense copper terephthalate》
The qualitative and quantitative elemental analyses of the obtained materials were investigated by EDS analysis.EDSmappings as shown in Fig.2 reveal the distribution of Cu and Co in the bulk materials while EDS spectra in Fig.3 presents the weight percentage of chemical composition found in Co15-CuBDC and Cu22-CuBDC.The results confirm the success of substitution of Co(II)into the CuBDC framework and the maximum doping amount of Co(II)is 21.7 wt%.The other quantitative elemental analysis such as inductively coupled plasma-atomic emission spectroscopy(ICP-AAS)could be done in addition to confirm the amount of Co(II)doped in the bulk CuBDC material.However,from literatures,the elemental analysis results from both EDS and ICP-AAS arebarely different.Therefore,the ICP-AAS was not conducted in this research(Binh et al.,2014;Li et al.,2012a;Xu,2016).The weight percentage of the chemical composition of the synthesized materials was summarized in Table 1.In this study,the materials with Co(II)doping percentage of 21.7%and 15.7%will be discussed and are denoted as Co22-CuBDC and Co15-CuBDC,respectively.
| 图表编号 | XD0033528700 严禁用于非法目的 |
|---|---|
| 绘制时间 | 2019.07.15 |
| 作者 | Chompoonoot Nanthamathee |
| 绘制单位 | Division of Chemistry, Department of Science, Walailak University |
| 更多格式 | 高清、无水印(增值服务) |
![表1 不同产地黄金尾矿的化学组成[3]Tab.1 Chemical composition of gold tailings from different habitats[3]](http://bookimg.mtoou.info/tubiao/gif/SDGC201901009_12200.gif)


