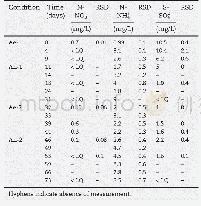
《Table 2–Temporal evolution of N-NO3-, N-NH4+and S-SO42-concentrations throughout incubation experim
 提示:宽带有限、当前游客访问压缩模式
本系列图表出处文件名:随高清版一同展现
《Phosphorus mobility in dam reservoir affected by redox oscillations:An experimental study》
The amount of NO3-decreased quickly from 50.0±0.7μmol/L(on Day 0)to a value under the LQ by Day 4(Table 2).During Ae-2,NO3-rose to 43μmol/L before quickly decreasing to 7±6μmol/L after the first day of the An-2 period.The NH4+concentration oscillated around 158±81 and 170±8μmol/L during Ae-1 and Ae-2,respectively.An increase in ammonium content was observed during anaerobic phases:from 121±36 to 643μmol/L during An-1,and from 186±29 to 607±50μmol/L during An-2(Table 2).The sulfate concentration declined from 327±12 to193±19μmol/L during Ae-1 and to below the LQ at the end of An-1.During Ae-2,the sulfate concentration climbed to 31±3μmol/L and then decreased below the LQ by the end of An-2.
| 图表编号 | XD0033520900 严禁用于非法目的 |
|---|---|
| 绘制时间 | 2019.03.15 |
| 作者 | Anne Rapin、Malgorzata Grybos、Marion Rabiet、Brice Mourier、Véronique Deluchat |
| 绘制单位 | Université de Limoges, PEIRENE EA 7500, Faculté des Sciences et Techniques、Université de Limoges, PEIRENE EA 7500, Faculté des Sciences et Techniques、Université de Limoges, PEIRENE EA 7500, Faculté des Sciences et Techniques、Université de Limoges, PEIRENE |
| 更多格式 | 高清、无水印(增值服务) |
查看“Table 2–Temporal evolution of N-NO3-, N-NH4+and S-SO42-concentrations throughout incubation experiment.”的人还看了
-

- 表10 不同摇床转速对A-25-8菌株发酵滤液抑菌活性及生长量的影响Table 10 Effect of shaker evolution on the growth and antifungal activity of strain A-
-

- Table 1 Metadata summary of the“Temporal-spatial cultivated land and conversion from dry farmland to paddy dataset in th
-

- 表2 庄4井地质历史时期实际孔隙度演化Tab.2 Key diagenetic events and actual porosity evolution of well Zhuang4 in geological history


