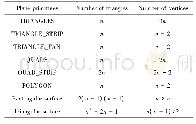
《Table 3 Ve rte x vs pixe l ratio》
 提示:宽带有限、当前游客访问压缩模式
本系列图表出处文件名:随高清版一同展现
《Power Consumption Optimization for 3D Graphics Rendering》
The nine examples used in this experiment is show n in Fig.3.Among them,the program gTrn,M an,M ap,Venus,Cow and Emboss are for static target testing,the program Little Jet,lesson6 and Dolphins are for dynamic target testing.Table 3 show s the number of pixels and the number of vertices in nine examples.The number of pixels and the number of vertices are obtained from the cycle-accurate performance simulation platform.The ratio of the pixel numbers and vertex numbers reflects the load of the vertex shader and the pixel shader.Fig.4 show s the comparison of the pow er consumption results of the vertex shader.Fig.5 show s the comparison of the pow er consumption of the pixel shader.As can be seen from the figure,in the absence of low-pow er technology,w hether it is vertex shaders or pixel shaders,the pow er consumption that each test program consumes changes little.With low-pow er programming technology,the pow er consumption changes greatly,at this time the pow er consumption is mainly related to the w orkload of vertex shader and pixel shader.
| 图表编号 | XD0033326600 严禁用于非法目的 |
|---|---|
| 绘制时间 | 2019.02.01 |
| 作者 | Lidong Xing、Tao Li、Hucai Huang、Jungang Han |
| 绘制单位 | School of Microelectronics,Xidian University、School of Electronic Engineering,Xi'an University of Posts and Telecommunications、School of Electronic Engineering,Xi'an University of Posts and Telecommunications、School of Electronic Engineering,Xi'an Univ |
| 更多格式 | 高清、无水印(增值服务) |


