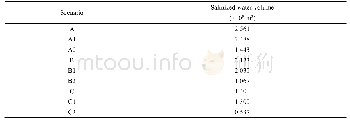
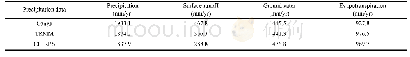
《Table 6 Salinized water volume for different simulated scenarios considering the 1500 mg/L iso-conc
 提示:宽带有限、当前游客访问压缩模式
本系列图表出处文件名:随高清版一同展现
《"Hydrological and economic feasibility of mitigating a stressed coastal aquifer using managed aquifer recharge: a case study of Jamma aquifer, Oman"》
Moving the injection wells to the vicinity of the farms(the stressed part of the aquifer,Scenario A2)due to the injection of 60.000×10³ m3/d of TWW in the downstream part of the aquifer,the inflows from both the coastline and southern boundaries into the aquifer decreased by 11.608×10³and 44 m3/d,respectively,against to Scenario A.It is similar to Scenario A1 because of the effects of the active irrigation wells in simultaneously recovering the injected water and hence the slow gain in storage.The groundwater table rises by 0.2 m on average(Table 5).
| 图表编号 | XD0031567200 严禁用于非法目的 |
|---|---|
| 绘制时间 | 2019.02.01 |
| 作者 | Mustafa EL-RAWY、Ali AL-MAKTOUMI、Slim ZEKRI、Osman ABDALLA、Rashid AL-ABRI |
| 绘制单位 | Sultan Qaboos University、Civil Engineering Department, Faculty of Engineering, Shaqra University、Department of Civil Engineering, Faculty of Engineering, Minia University、Sultan Qaboos University、Sultan Qaboos University、Sultan Qaboos University、Ministry |
| 更多格式 | 高清、无水印(增值服务) |

