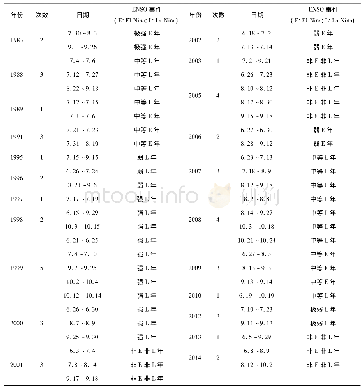
《Table 4.Extreme events for ENSO, QBO and solar cycle during 1979–2010》
 提示:宽带有限、当前游客访问压缩模式
本系列图表出处文件名:随高清版一同展现
《"Evaluating the Brewer–Dobson circulation and its responses to ENSO, QBO, and the solar cycle in different reanalyses"》
We quantify the BDC diagnosed from the ten available reanalyses listed in Table 1,including CFSR(Saha et al.,2010),ERA40(Uppala et al.,2005),ERAIN(Dee et al.,2011),JRA25(Onogi et al.,2007)JRA55(Ebita et al.,2010),MERRA(Rienecker et al.,2011),NCEP1(Kalnay et al.,1996),NCEP2(Kanamitsu et al.,2002),ECMWF’s20CR(Hersbach et al.,2015),and NOAA’s 20CR(Compo et al.,2011).See Table 1 for their full names and refer to the SPARC Reanalysis Intercomparison Project for more details(Fujiwara et al.,2017).Most reanalyses,including ERA40,ERAIN,JRA25,NCEP1,NCEP2,and 20CR-NOAA have been used to assess the polar vortex oscillation events in Rao J et al.(2015).In this study,CFSR,JRA55,MERRA,and 20CR-ECMWF are also included to make a relatively more comprehensive comparison between BDCs in ten datasets.More information about the spatial resolution,vertical level number,and references are provided in Table 1.We also use the Hadley Centre Sea Ice and Sea Surface Temperature(SST)dataset(Rayner et al.,2003)to select ENSO events.The CESM1-WACCM is a fully coupled earth system model with a stratosphere-solving atmosphere,which has been widely used to study the atmospheric response to SST forcing(Xie F et al.,2012;Ren RC et al.,2017;Rao J and Ren RC,2018).The CESM1-WACCM historical free-running simulation was performed with all observed forcings from 1850 to 2005.The model includes interactive chemistry,ocean,land,and sea ice.The observed forcings include changes in surface concentrations of radiatively active species,daily solar spectral irradiance,volcanic sulfate heating,and the QBO(Marsh et al.,2013).The daily outputs of the historical run by CESM1-WACCM are diagnosed.
| 图表编号 | XD0030290700 严禁用于非法目的 |
|---|---|
| 绘制时间 | 2019.03.01 |
| 作者 | Jian Rao、YueYue Yu、Dong Guo、ChunHua Shi、Dan Chen、DingZhu Hu |
| 绘制单位 | Key Laboratory of Meteorological Disaster, Ministry of Education (KLME)、Joint International Research Laboratory of Climate and Environment Change(ILCEC)、Collaborative Innovation Center on Forecast and Evaluation of Meteorological Disasters (CIC-FEMD), Nan |
| 更多格式 | 高清、无水印(增值服务) |
查看“Table 4.Extreme events for ENSO, QBO and solar cycle during 1979–2010”的人还看了
-

- 表3 西北太平洋极端低温事件与ENSO事件的关系Tab.3 Relationship between extreme low temperature events and ENSO events at the Northwest Pacif


