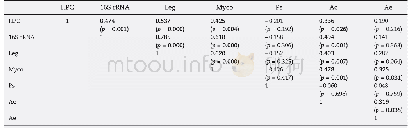
《Table 3–Spearman correlation analysis between the microorganisms during the four sampling events (n
 提示:宽带有限、当前游客访问压缩模式
本系列图表出处文件名:随高清版一同展现
《One-year survey of opportunistic premise plumbing pathogens and free-living amoebae in the tap-water of one northern city of China》
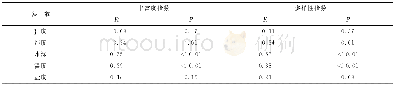
The bold numbers represented significance under p<0.05.Leg,Myco,Ps,Ac,Ae represented Legionella spp.,Mycobacterium spp.,P.aeruginosa,Acanthamoeba spp.,and Aeromonas spp.respectively.
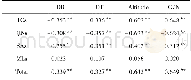
Nonparametric Spearman's rank correlation analysis has often been used to analyze the correlations between different target microorganisms and water quality parameters,based on a previously published study(Wang et al.,2012b).Therefore,the relationships between OPPPs and chlorine,AOC,BDOC,and turbidity were analyzed by Spearman correlative analysis.As shown in Table 2,16S r RNA genes(rs=-0.484,p=0.001),Legionella spp.(rs=-0.559,p=0.000),Mycobacterium spp.(rs=-710,p=0.000),Acanthamoeba spp.(rs=-0.311,p=0.040)and Aeromonas spp.(rs=-0.434,p=0.003)were negatively correlated with chlorine concentration.However,no significant correlated relationships between OPPPs and AOC,BDOC,or turbidity were found(p>0.05).The relationships between OPPPs and chlorine were also analyzed by linear regression,and were found to be basically consistent with the results of Spearman correlative analysis(Appendix A Fig.S6).For example,the Legionella spp.and Mycobacterium spp.had a negative linear relationship with chlorine(R2=0.2650 and 0.4055,p<0.05).Table 3 shows microbial correlations between the target microorganisms by Spearman correlation analysis.Moderate to strong correlation existed among HPC,16S r RNA genes,Mycobacterium spp.,and Legionella spp.(rs=0.425–0.785,p<0.05).In particular,moderate correlations existed between Acanthamoeba spp.and OPPPs(except P.aeruginosa)(rs=0.319–0.478,p<0.05) .
| 图表编号 | XD0033515300 严禁用于非法目的 |
|---|---|
| 绘制时间 | 2019.03.15 |
| 作者 | Lizhong Liu、Xueci Xing、Chun Hu、Haibo Wang |
| 绘制单位 | Key Laboratory of Drinking Water Science and Technology, Research Center for Eco-Environmental Sciences, Chinese Academy of Sciences、University of Chinese Academy of Sciences、Key Laboratory of Drinking Water Science and Technology, Research Center for Eco |
| 更多格式 | 高清、无水印(增值服务) |

