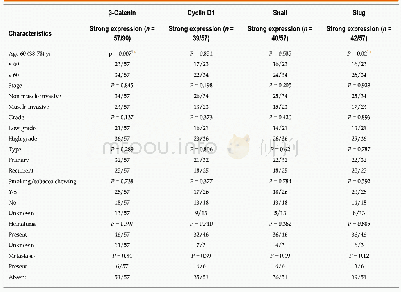
《Table 4Spearman correlation analysis between duration of hypothermia and medical variables.》
 提示:宽带有限、当前游客访问压缩模式
本系列图表出处文件名:随高清版一同展现
《The changes of intraoperative body temperature in adult liver transplantation: A retrospective study》
r s:Spearman correlation coefficient;ICU:intensive care unit.
On the basis of surgical procedure,the changes in body temperature were divided into 6 phases:phase 1(T 0–T 1):the anesthesia induction phase,during which the body temperature was relatively stable(range of temperature variation:0.05±0.33°C;95%CI:-0.02 to 0.12;change rate:0.04±0.29°C/h);phase 2(T 1–T 4):the abdominal opening phase,during which the body temperature gradually decreased(range of variation:0.46±0.51°C;95%CI:0.34to 0.57;change rate:0.12±0.18°C/h);phase 3(T 4–T 8):the anhepatic phase,during which the body temperature further gradually decreased(range of variation:0.70±0.55°C;95%CI:0.59 to 0.80;change rate:0.66±0.51°C/h);phase 4(T 8–T 9):the initial phase of reperfusion,during which body temperature dropped sharply(range of variation:0.32±0.37°C;95%CI:0.25 to 0.40;change rate:3.89±4.45°C/h);phase 5(T 9–T 13):the later phase of reperfusion,during which body temperature gradually increased(range of variation:-1.15±0.54°C;95%CI:-1.25 to-1.05;change rate:-0.61±0.29°C/h);and phase 6(T 13–T 14):the abdominal closure phase,during which body temperature gradually ascended(range of variation:-0.21±0.18°C;95%CI:-0.25 to-0.17;change rate:-0.23±0.21°C/h).Compared with phase 1,phases 2–6 demonstrated greater change rates of body temperature per hour.The change in body temperature at each phase is presented in Table 1.
| 图表编号 | XD0020456400 严禁用于非法目的 |
|---|---|
| 绘制时间 | 2018.12.15 |
| 作者 | Ying Sun、Li-Li Jia、Wen-Li Yu、Hong-Li Yu、Ming-Wei Sheng、Hong-Yin Du |
| 绘制单位 | Department of Anesthesiology, Tianjin First Center Hospital、Department of Anesthesiology, Tianjin First Center Hospital、Department of Anesthesiology, Tianjin First Center Hospital、Department of Anesthesiology, Tianjin First Center Hospital、Department of A |
| 更多格式 | 高清、无水印(增值服务) |
查看“Table 4Spearman correlation analysis between duration of hypothermia and medical variables.”的人还看了
-

- Table 1 Correlation analysis between stem tapering grade and growth traits of central shaft of free spindle-shaped short
-

- Table 2 Correlation analysis between stem tapering grade and the growth traits of the central shaft of free spindle-shap
-

- Table 4 Statistical analysis for correlation between expression of target genes at transcriptome level in tumor tissues
-

- 表1 单因素分析老年胶质瘤患者临床特征与生存时间的相关性Table 1 Univariate analysis of correlation between clinical characteristics and survival tim


