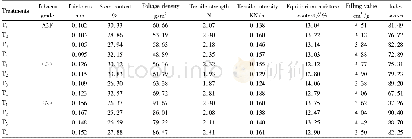
《Table 1Summary of physical properties and photocatalytic activities of as-prepared TiO2 samples.》
 提示:宽带有限、当前游客访问压缩模式
本系列图表出处文件名:随高清版一同展现
《"结晶度,{001}/{101}晶面比和Au负载对热处理TiOF_2制备的锐钛矿TiO_2光催化活性的影响(英文)"》
The XRD patterns of the Ti O2 samples obtained from the calcination of TiOF2 at different temperatures are shown in Fig.1a,which also indicates the crystal planes corresponding to each peak[44].The characteristic peaks of T0 match well with those of TiOF2(JCPDS No.01-0490),which indicates the TiOF2phase of the hydrothermal product.On the other hand,all XRD peaks of the annealed samples correspond to diffractions of the anatase TiO2 planes(JCPDS No.99-0008),revealing that TiOF2transformed into the anatase TiO2 phase after calcination.The weak peak observed for the sample calcined at 800°C corresponds to the(110)diffraction of rutile Ti O2(JCPDS No.88-1175),which indicates that that rutile phase was also present in this sample.To confirm the presence of the rutile phase,Fig.1b shows enlarged views of the T700 and T800 patterns in the 24°–28°region.Compared to that from the pure anatase phase of T700,a weak XRD peak at 27.5°arising from rutile Ti O2 can be clearly seen in T800.However,the amount of rutile phase is much lower than that of anatase phase.T500 was selected as reference sample with a relative crystallinity(RC)of 1,and the RC of the other samples was estimated based on the intensity of their(101)peak relative to that of T500.Table 1shows that the RC increases with an increase in annealing temperature.The RC of T800 shows a slight decrease due to the phase transformation from anatase to rutile.The samples maintain an almost pure anatase structure at the calcination temperature of 800°C,much higher than the 600°C value generally associated with the transformation from anatase to rutile.F–ions in the samples are considered to play an important role in inhibiting the anatase-to-rutile transformation[45],increasing the phase transition temperature by about 200°C.The average sizes of anatase TiO2 crystallites were estimated from the(101)peak using the Scherrer equation,which yielded values of 55.4,66.4,65.4,and 71.3 nm for the T500,T600,T700,and T800 samples,respectively.Because the presence of F–ions favors the formation of(001)exposed facets,the ratios of{001}to{101}exposed facets were calculated and are shown in Table 1.In order to calculate the{001}/{101}ratio,a schematic diagram of the anatase TiO2 structure[46]is shown in Fig.3f.
| 图表编号 | XD0028866100 严禁用于非法目的 |
|---|---|
| 绘制时间 | 2019.03.01 |
| 作者 | 王江炎、刘保顺、中田一弥 |
| 绘制单位 | 武汉理工大学硅酸盐建筑材料国家重点实验室、武汉理工大学硅酸盐建筑材料国家重点实验室、东京理科大学科学技术研究所光催化国际研究中心、东京理科大学理工学部应用生物科学系 |
| 更多格式 | 高清、无水印(增值服务) |

