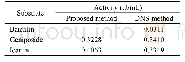
《Table 1Prediction methods of decision fusion method and direct and indirect computation me thods》
 提示:宽带有限、当前游客访问压缩模式
本系列图表出处文件名:随高清版一同展现
《Prediction of Potential Disease-Associated MicroRNAs Based on Hidden Conditional Random Field》
The numbers denotes the AUC of each method(direct and indirect computation method,and decision fusion method)performing on the corresponding dataset(lung cancer:GSE68951,breast cancer:GSE58606,and colorectal cancer:GSE41655).
Finally,the receiver operating characteristics(ROC)curve is plotted according to true positive rate(TPR)versus false positive rate(FPR)at different thresholds and the results are show n in Fig.3 and Table 1.Sensitivity refers to the percentage of the test miRNAs w hich are predicted as positive ones and specificity stands for the percentage of miRNAs w hich are predicted as negative ones.In Fig.3,the curve w ith arrow denotes the ROC of GSE68951,the curve w ith rhombus stands for the ROC of GSE41655,and the last curve denotes the ROC of GSE58606.The area under ROC curve(AUC)is calculated,and the values of AUC are 0.656 8,0.727 2,and 0.699 3correspondingtoGSE68951,GSE58606and GSE41655,respectively.
| 图表编号 | XD0024931300 严禁用于非法目的 |
|---|---|
| 绘制时间 | 2018.02.01 |
| 作者 | Maozu Guo、Shuang Cheng、Chunyu Wang、Xiaoyan Liu、Yang Liu |
| 绘制单位 | School of Computer Science and Technology,Harbin Institute of Technology、School of Electrical and Information Engineering,Beijing University of Civil Engineering and Architecture、Beijing Key Laboratory for Research on Intelligent Processing Method of Buil |
| 更多格式 | 高清、无水印(增值服务) |


