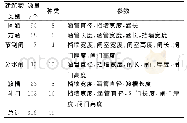
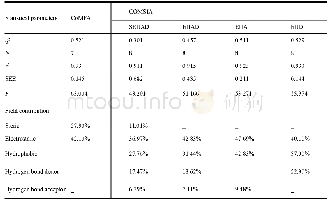
《Table 2Best-fitted equilibrium parameters and statistical errors of EBP functions for beaches along
Parameter units:B(m);k(m-1);So(%);A(m1/3);m(–);ρ(–);xs(m);Hos(m);w(cm/s);C(m);D(m-1);F(m-1);G(m);xo (m)
In Zone 1,two typically investigated cross sections are those of Gapeau and Ayguade.At Gapeau beach,nine beach profiles measured from 2001 to 2010 by E.O.L.were supplied for this work.The average slope of Gapeau beach is about 1.6%from the shoreline to 450 m offshore(Table 1).Seven EBP models were fitted to the measured data of the nine beach profiles by using the nonlinear least-squares methods.Results reveal that the Dean(1977)and Romańczyk et al.(2005)EBP curves have identical R2of 0.8514 and RMSE of 0.7707,but the EBP function of Komar and Mc Dougal(1994)provides the best fit to the measured data with an R2of 0.9992 and RMSE of 0.0551(Table 2).The average measured profile was also compared with seven EBP models(Fig.2),and the best consistency found is with Komar and Mc Dougal’s(1994)equation.The surface error between the EBP function of Komar and Mc Dougal(1994)and the average beach profile is only about+3.1 m2per profile unit,whichmeans the beach profile somewhat expresses the equilibrium profile condition.However,the beach face from the foreshore to the shoreface tends to flatten to achieve the equilibrium shape without bars as these EBPs do not take into account unidirectional currents or the migration of sand bars during storm events and the flood season(Kaiser and Frihy 2009).The EBP expression of Komar and Mc Dougal(1994)can fairly represent the evolution of the Gapeau beach profile if the average predicted Sois kept at around 1.56%(Table 2).
| 图表编号 | XD0024728400 严禁用于非法目的 |
|---|---|
| 绘制时间 | 2018.06.25 |
| 作者 | Minh Tuan Vu、Yves Lacroix、Viet Thanh Nguyen |
| 绘制单位 | SEATECH, University of Toulon、University of Transport and Communications,Hanoi、SEATECH, University of Toulon、MEMOCS, Università Degli Studi dell'Aquila、University of Transport and Communications,Hanoi |
| 更多格式 | 高清、无水印(增值服务) |
 提示:宽带有限、当前游客访问压缩模式


