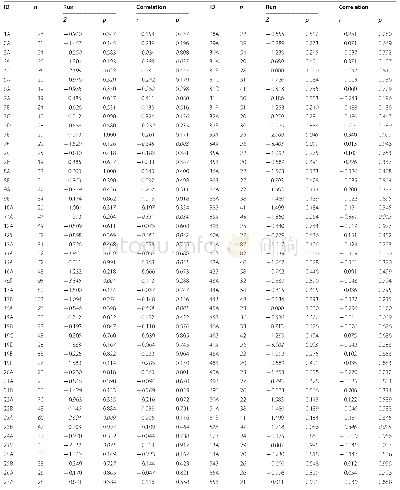
《Table 2 Variation in PM10 concentration rate and durations of increase or decrease from the 20 case
 提示:宽带有限、当前游客访问压缩模式
本系列图表出处文件名:随高清版一同展现
《"Characteristics of air pollution events over Hotan Prefecture at the southwestern edge of Taklimakan Desert,China"》
Note:The meaning of Tup,Vup,Tdown,and Vdown refer to Section 3.2.
The characteristics of PM10 concentration variation from 20 cases of strong dust storm events that occurred between 2004 and 2010 are summarized in Table 2 to confirm whether,or not,this kind of variation pattern(i.e.,\""sharp increase followed by slow decrease\"")in hourly mean PM10concentrations in Hotan Prefecture during dust storm events is common.To further address this process,increase and decrease rates as well as durations for PM10 concentration are computed statistically.During these dust storm processes,variations in PM10 concentrations are characterized by a significant increase within a short period from the onset of dust storms followed by a remarkably slower decrease over a relatively long time while a dust storm start to weaken.The average time of increase of PM10 concentration is 63 min over the 20 cases assessed in this study.The shortest lasting time in which PM10 concentration increased to the maximum was 25 min;this yielded a mean PM10 concentration rate of increase rate of 163.4μg/(m3·min).In contrast,the longest time duration during which the PM10 concentration decreased to the minimum was 1262min,while the average time reduction over the 20 dust storm cases was 328 min,over five times the length of the PM10 concentration increase.Similarly,the mean decrease rate of PM10concentration was 41.8μg/(m3·min),one quarter the mean increase rate.Statistics from 20 dust storms in Hotan Prefecture are consistent with a\""sharp increase followed by a slow decrease\"".Previous research by Yang et al.(2016)suggested that variations in dust events are mainly affected by strong winds and daily temperatures with correlation coefficients of 0.46 and–0.41 for dust events respectively across the whole Taklimakan Desert.This correlation analysis indicates that a strong wind is the dominant factor that results in the formation of sand-dust storms.At the same time,temperature is also negatively correlated with the number of dust storm days in the Taklimakan Desert(Xiao et al.,2008)and is indicative of the influence of cold air activity on these events.
| 图表编号 | XD0020361300 严禁用于非法目的 |
|---|---|
| 绘制时间 | 2018.10.01 |
| 作者 | LI Jingxin、WANG Shigong、CHU Jinhua、WANG Jiaxin、LI Xu、YUE Man、SHANG Kezheng |
| 绘制单位 | State Key Laboratory of Severe Weather, Chinese Academy of Meteorological Sciences、Sichuan Key Laboratory of Plateau Atmosphere and Environment, College of Atmospheric Sciences, Chengdu University of Information Technology、Gansu Key Laboratory of Arid Cli |
| 更多格式 | 高清、无水印(增值服务) |
查看“Table 2 Variation in PM10 concentration rate and durations of increase or decrease from the 20 cases of dust storm durin”的人还看了
-

- Table 3 Comparison of total inhibitory rates after BPDC treatment under different concentrations in HepG-2 cells


