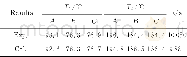
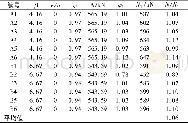
《表4 试验结果和模拟计算结果对比Table 4 Comparison of the test results and the simulation calculation ones》
 提示:宽带有限、当前游客访问压缩模式
注:T1为试样发生相变时监测点温度;T2为试样响应时监测点温度;t为响应时间。
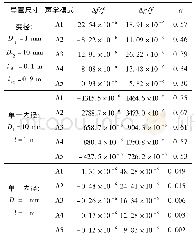
装药尺寸为Φ19mm×38mm的DNAN基熔铸混合炸药数值计算与试验结果对比见表4,装药尺寸Φ19mm×38mm的DNAN基熔铸混合炸药计算与试验的时间-温度曲线如图6所示。
| 图表编号 | XD002017200 严禁用于非法目的 |
|---|---|
| 绘制时间 | 2018.04.01 |
| 作者 | 赵亮、智小琦、高峰、范兴华、曾稼 |
| 绘制单位 | 中北大学机电工程学院、中北大学机电工程学院、内蒙古北方重工业集团有限公司、晋西工业集团有限责任公司、中北大学机电工程学院 |
| 更多格式 | 高清、无水印(增值服务) |