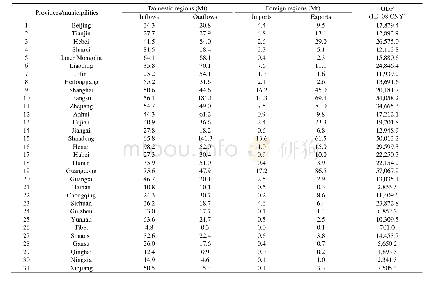
《Table 6 Energy demand and carbon emissions in 2030 (%)》
 提示:宽带有限、当前游客访问压缩模式
本系列图表出处文件名:随高清版一同展现
《China's new growth pattern and its effect on energy demand and greenhouse gas emissions》
Source:CHINAGEM baseline and policy simulations.
In Scenario 1,increasing household consumption and household preference for gas(relative to baseline levels)results in slightly higher economy-wide shares of gas and non-fossil fuels by the end of the projection period.The cleaner energy consumption structure reduces the carbon emissions.Table 6 shows that in 2020 in Scenario 1,total CO2 emissions are 0.2 billion tonnes lower than in the baseline scenario.This lowers carbon intensity by around one percentage point.
| 图表编号 | XD0020051800 严禁用于非法目的 |
|---|---|
| 绘制时间 | 2018.10.01 |
| 作者 | Xiujian Peng、Philip D.Adams、Jin Liu |
| 绘制单位 | Centre of Policy Studies, Victoria University、Centre of Policy Studies, Victoria University、Parliamentary Budget Office |
| 更多格式 | 高清、无水印(增值服务) |


