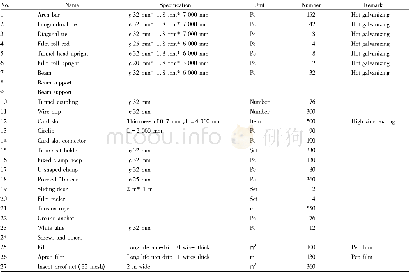
《Table 2 Contribution of major construction materials to total weight and carbon emissions》
 提示:宽带有限、当前游客访问压缩模式
本系列图表出处文件名:随高清版一同展现
《Life cycle carbon emission assessment of a multi-purpose university building:A case study of Sri Lanka》
Note:avalues of material carbon emission coefcients extracted from studies (University of Bath UK,2011;Tae et al.,2011;Roh and Tae,2016)
In calculating carbon emissions during the material transportation stage,current material transportation practices in Sri Lanka were considered.The average distances for transporting each material were estimated and the twoway transportation distances were used in the calculations.The carbon emission factors for the type of transportation were calculated using data obtained from relevant literature,especially based on Asian countries(Tae et al.,2011;Pinky Devi and Palaniappan,2014;Sim et al.,2016)and international reports.The construction professionals and material suppliers in Sri Lanka were also consulted.A summary of the carbon emissions at the material transportation stage is given in Table 3.The main factor that affected the carbon emissions in this stage was the material quantity as evidenced from ready-mixed concrete which contributed to 76.47%of total transportation carbon,followed by sand(10.14%).As the average material transportation distances were not high for this particular construction site,transport distance did not play a signi?cant role in the production of carbon emission.The carbon emissions of material transportation were found to be 7.41 kg·m–2CO2.
| 图表编号 | XD0018447500 严禁用于非法目的 |
|---|---|
| 绘制时间 | 2018.09.01 |
| 作者 | Ramya KUMANAYAKE、Hanbin LUO |
| 绘制单位 | Department of Construction Management, School of Civil Engineering and Mechanics, Huazhong University of Science and Technology、Department of Construction Management, School of Civil Engineering and Mechanics, Huazhong University of Science and Technology |
| 更多格式 | 高清、无水印(增值服务) |
查看“Table 2 Contribution of major construction materials to total weight and carbon emissions”的人还看了
-

- Table 2.contribution percentages of the pm2.5 mass concentra-tion to Beijing from several regions against different air


