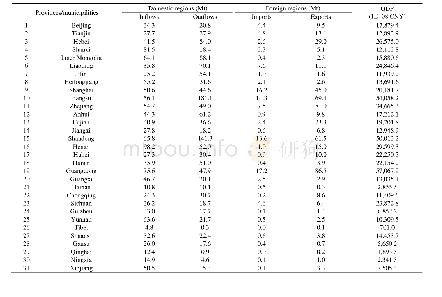
《Table A4 Classification of China’s sub-regions by intra-and inter-national carbon emission flows》
 提示:宽带有限、当前游客访问压缩模式
本系列图表出处文件名:随高清版一同展现
《China's intra-and inter-national carbon emission transfers by province: A nested network perspective》
Figure 1 provides an overall picture of China’s socioeconomic indicators including GDP and population,with the approval number GS(2016)2884 of the original map from the Standard Map Service of Ministry of Natural Resources.The detailed regional classification is presented in Appendix Table A1(http://earth.scichina.com).Overall,East and South coastal regions generate the highest GDP,while the less developed provinces are mainly located in Northwest and Southwest China.Specifically,Guangdong creates a value of 5706.8billion CNY,with the highest GDP in China.In contrast,Tibet as the typical region in Southwest China has the lowest GDP in China.As for the distribution of population,a significant concentration is in Eastern regions,with about 397.02 million people,almost twice the population of Central China.Among them,Guangdong was the province with the highest population of 105.94 million.By contrary,the Northwest regions occupied the lowest population of 97.83 million in China.Details are presented in Appendix Table A2.
| 图表编号 | XD00162169200 严禁用于非法目的 |
|---|---|
| 绘制时间 | 2020.06.01 |
| 作者 | Mengyao HAN、Qiuhui YAO、Junming LAO、Zhipeng TANG、Weidong LIU |
| 绘制单位 | Institute of Geographic Sciences and Natural Resources Research, Chinese Academy of Sciences、Key Laboratory of Regional Sustainable Development Modeling, Chinese Academy of Sciences、College of Resources and Environment, University of Chinese Academy of Sc |
| 更多格式 | 高清、无水印(增值服务) |

