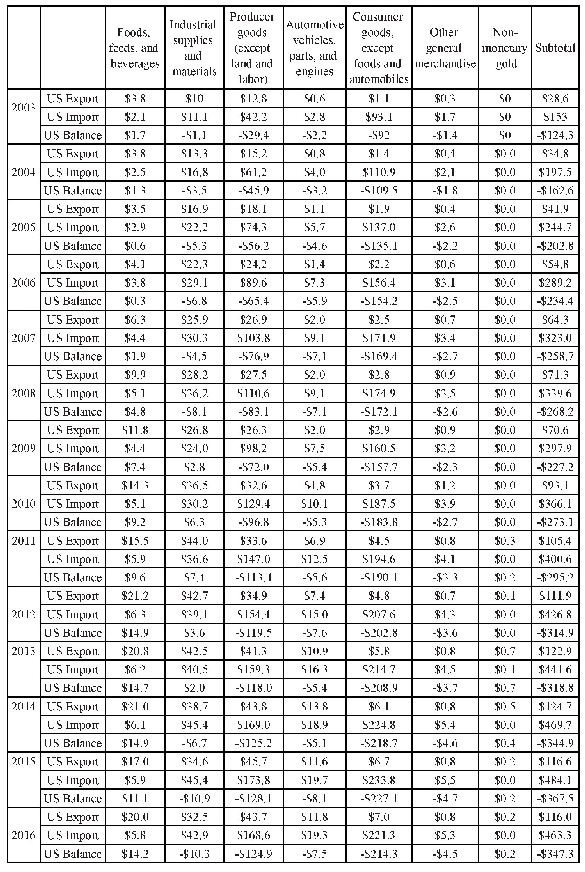
《Table 1.US-China Trade in Goods by Industry (In Billions of US Dollars)》
 提示:宽带有限、当前游客访问压缩模式
本系列图表出处文件名:随高清版一同展现
《Is US-China Trade Really “Imbalanced”——Empirical Analysis Based on Data from the US Bureau of Economic Analysis》
Judging from the structure of goods export(Table 1),firstly,the vast majority of industries demonstrated a trade volume consistent with the general trade trend,maintaining gradual increase year by year.Secondly,the largest differences in US-China goods trade lies in consumer goods,except foods and automobiles;capital goods,except for automobiles;and foods,feeds and drinks.China exported the former two more than imported them,while the United States exported a greater amount of foods,feeds and drinks to China as opposed to importing the same types of commodities from China.
| 图表编号 | XD00212157300 严禁用于非法目的 |
|---|---|
| 绘制时间 | 2018.06.01 |
| 作者 | Hu Tao、Yang Di |
| 绘制单位 | WWF-US Office、WWF-US Office |
| 更多格式 | 高清、无水印(增值服务) |
查看“Table 1.US-China Trade in Goods by Industry (In Billions of US Dollars)”的人还看了
-

- Table 3 The TII of agricultural products trade between China and four South Asian countries in 2006-2016
-

- Table 1 The income on investment of the food industry in the three northeastern provinces of China and the entire countr


